IMAGE

Figure 4

ID
ZDB-IMAGE-221214-179
Source
Figures for Poudel et al., 2022
Image
Figure Caption

Figure 4

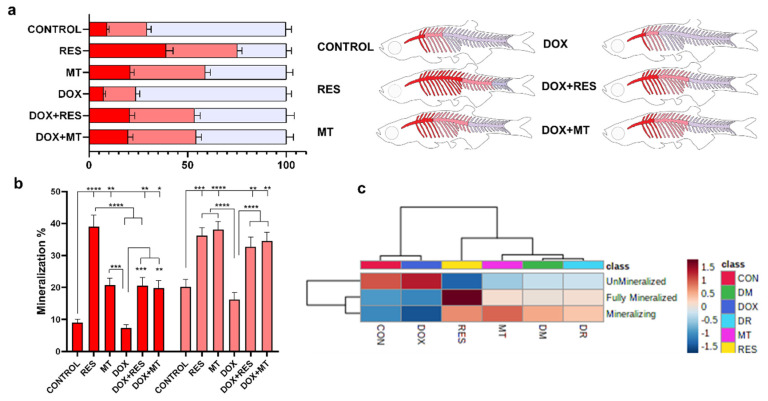
Mineralization of zebrafish vertebral column. Percentage of mineralized (red), mineralizing (pink), unmineralized (blue) vertebrae (a) and graphical representation of the mineralization status of the zebrafish. Mineralization status of the vertebrate (b), (red represents mineralized vertebrae and pink represents mineralizing vertebrate). Heat map of mineralization of vertebrae of zebrafish feed with resveratrol (RES), MitoTEMPO (MT) and doxorubicin (DOX) supplemented microdiets (c). Levels of significance were calculated using Tukey’s multiple comparisons (one-way ANOVA) [* p ≤ 0.05, ** p ≤ 0.01, *** p ≤ 0.001, **** p ≤ 0.0001] [N = 20 × 4].

Figure Data
Acknowledgments
This image is the copyrighted work of the attributed author or publisher, and ZFIN has permission only to display this image to its users. Additional permissions should be obtained from the applicable author or publisher of the image. Full text @ Nutrients