
|
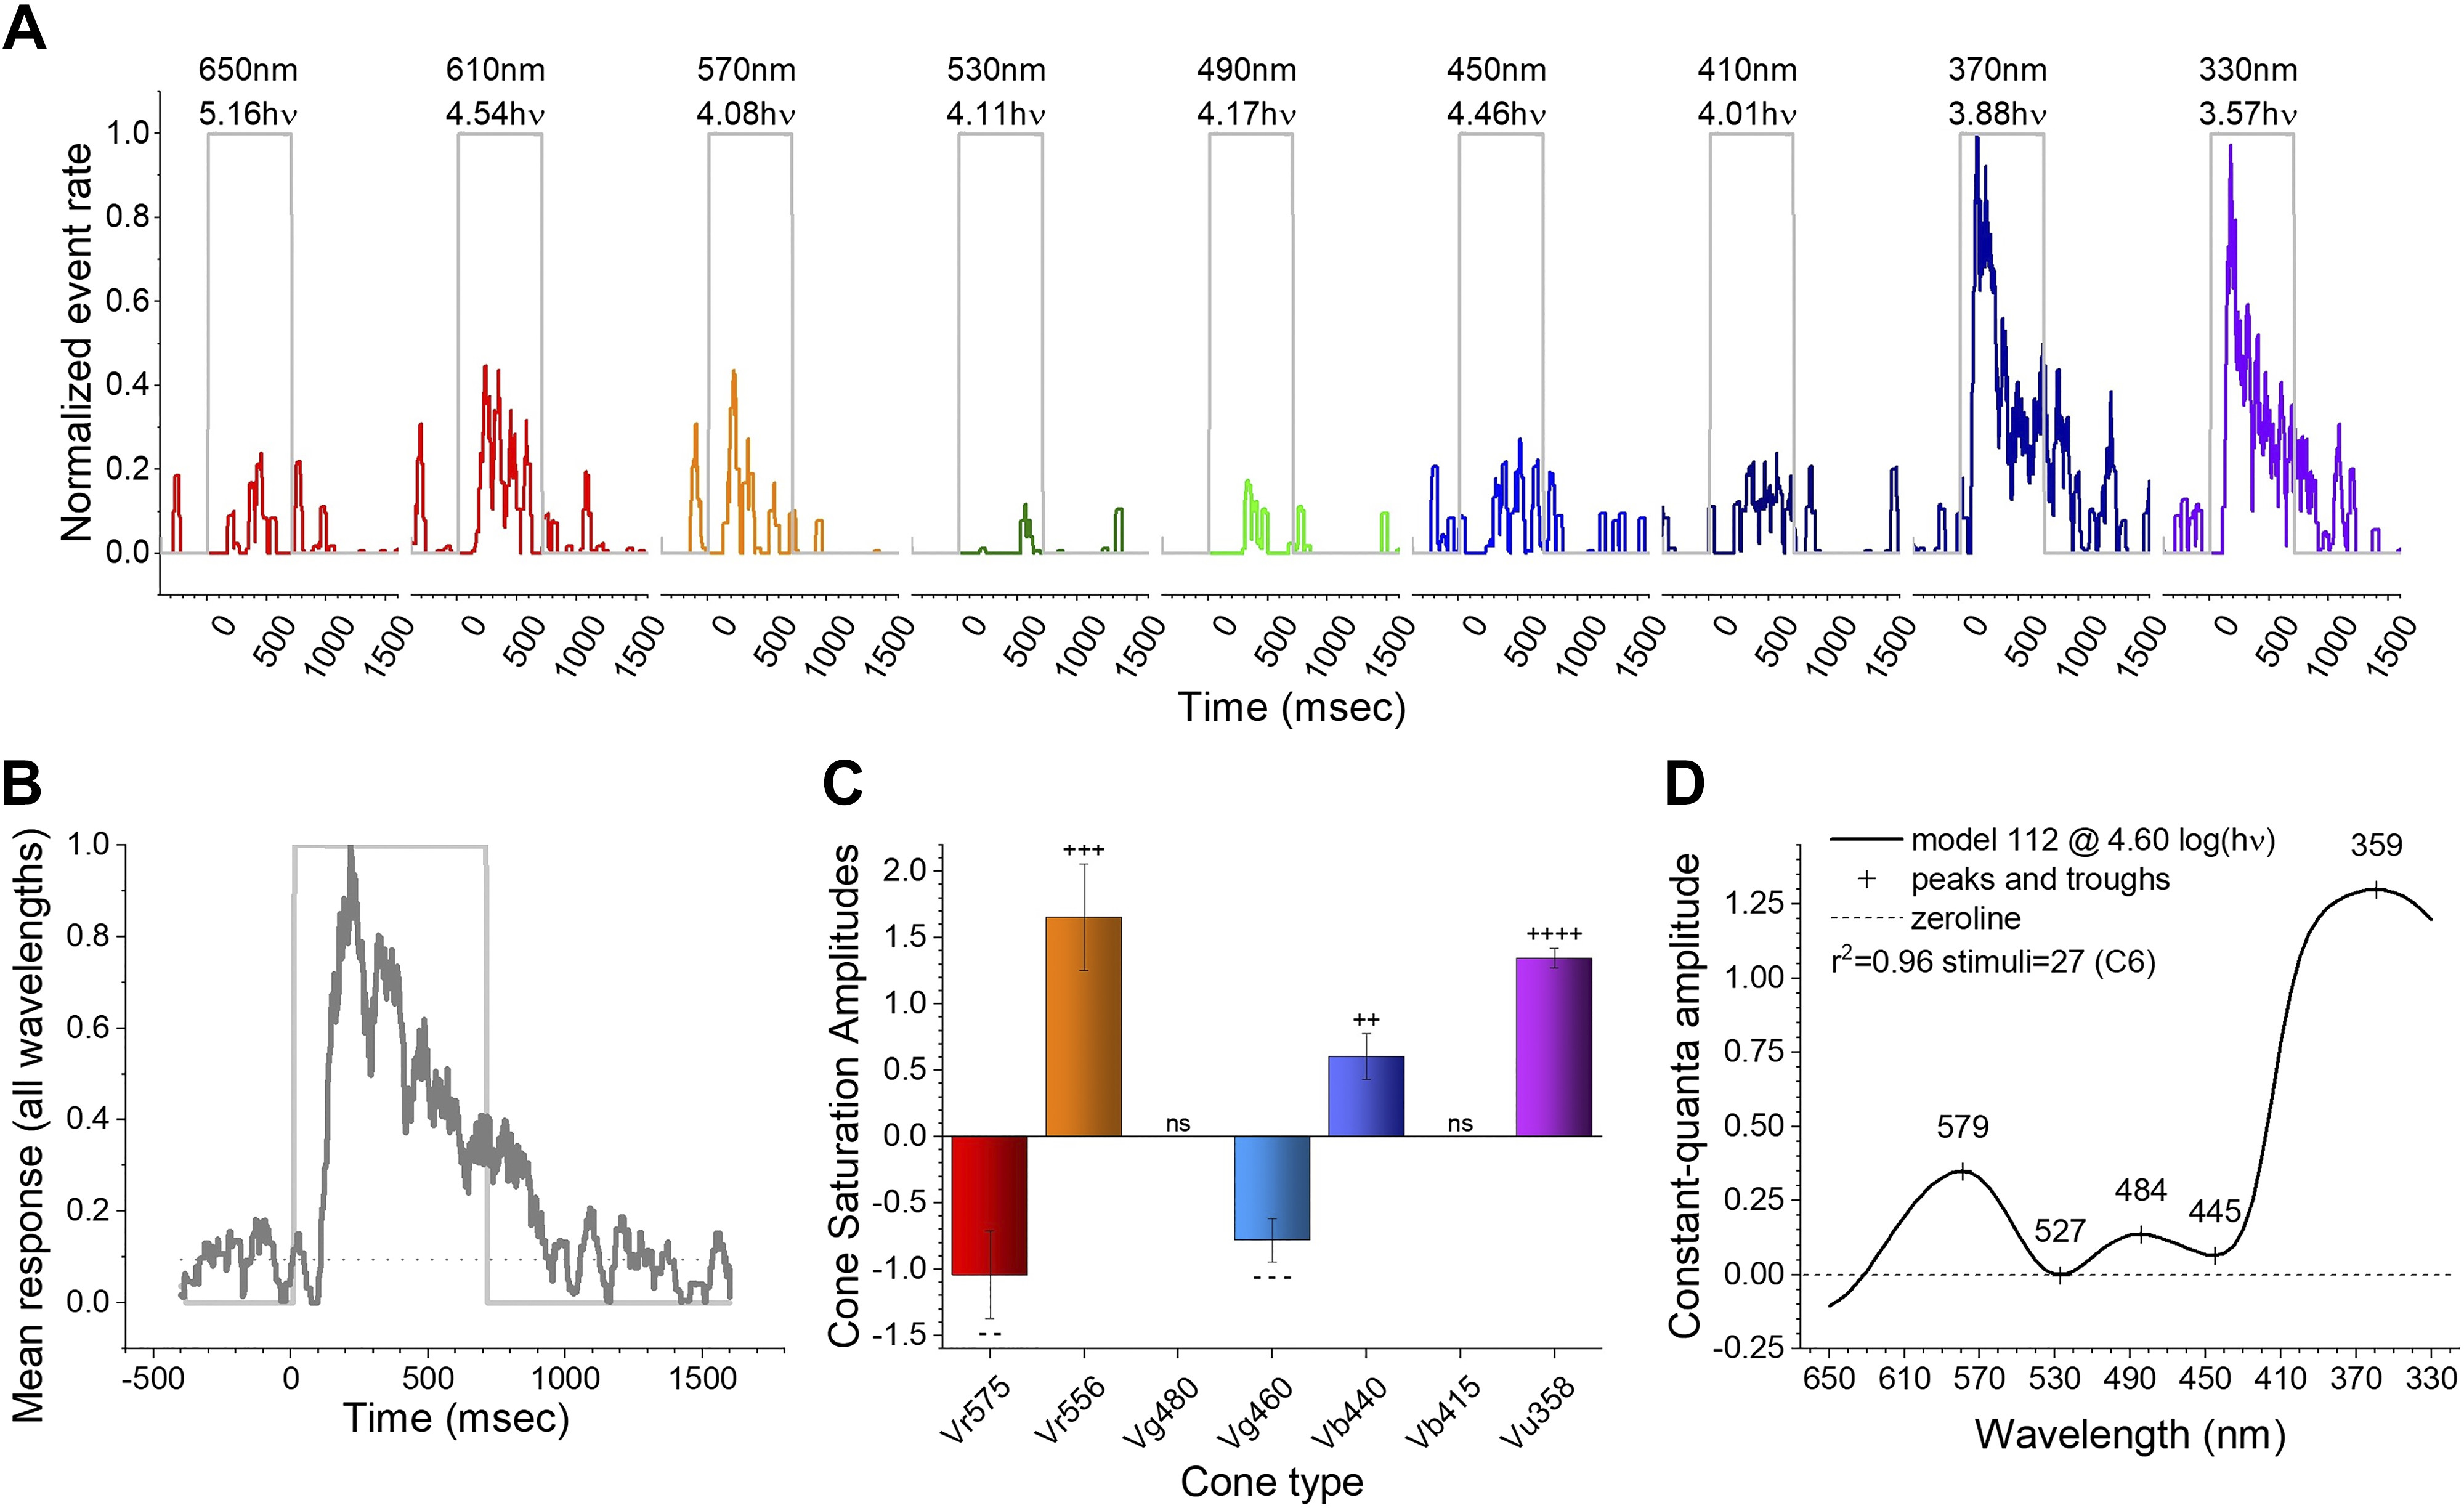
Fig. 4 Fitting the sample C6 impulse data to a spectral model. A: impulse events (shown in Fig. 2) are detected, and the running averages of events in a 50-ms time bin are displayed as normalized event rates. Wavelengths are color coded and shown above each stimulus trace. The number below each wavelength is the irradiance in log(quanta·µm−2·s−1) (where hν = quanta). C6 stimulus protocol. B: the mean waveform for all 9 wavelengths shows increased activity throughout the 700-ms stimulus. C: the best-fitting model (112) uses 5 cone signals to represent the data set. + and − indicate significance of excitatory or inhibitory signals. respectively, with the number of symbols representing t test significance (GraphPad convention). D: event-rate amplitudes for constant quantal stimulation across wavelengths [log(quanta·µm−2·s−1) = 4.60] for the best-fitting model (112). No other model had a comparable residual variance (F test, P ≥ 0.95).