Image
Figure Caption
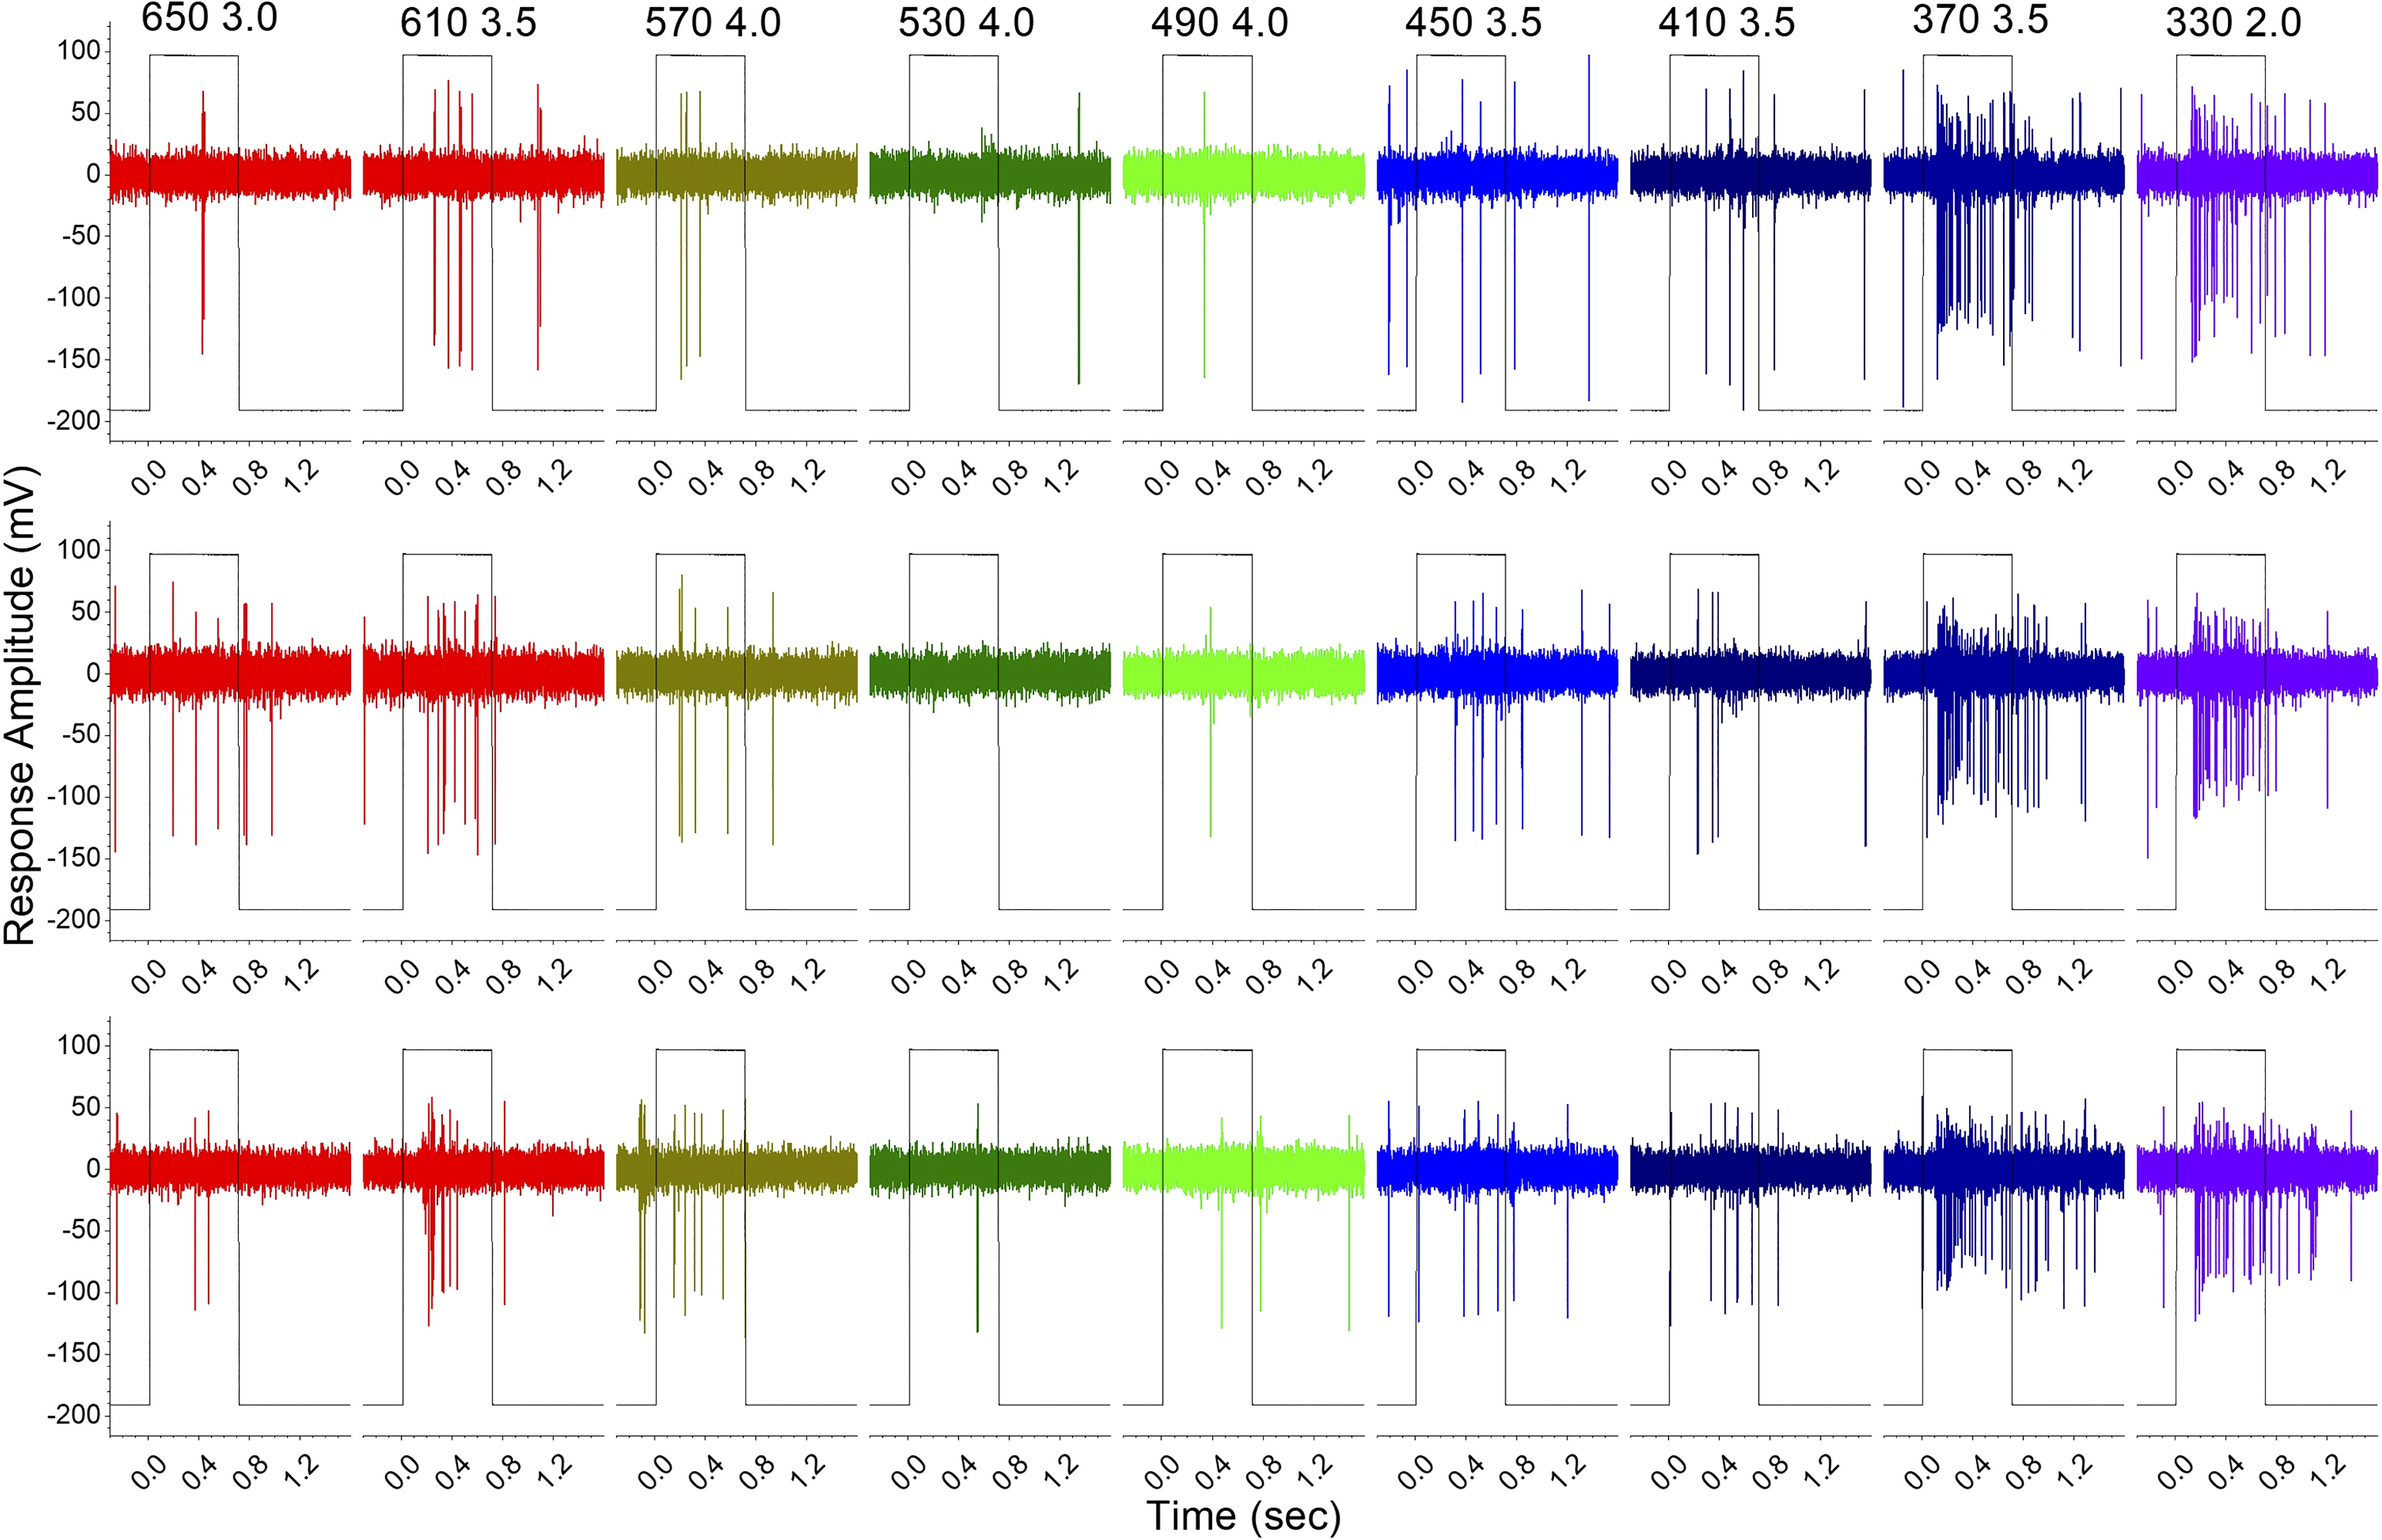
Fig. 2 Spectral response data set for C6 stimulus protocol. This 5 days postfertilization (dpf) ganglion cell is most sensitive to long (610 nm)- and short (370–330 nm)-wavelength stimuli, while appearing inhibited in the midspectrum (530–490 nm). The spikes are shown after 200-Hz high-pass filtering and Savitsky–Golay smoothing (10 points, 1 ms, order 3). The rectangular traces indicate light stimulation. The column headers give the wavelength and log of neutral-density attenuation of the beam used in the C6 stimulus protocol. The modeling of this data set appears in Fig. 4.
Acknowledgments
This image is the copyrighted work of the attributed author or publisher, and
ZFIN has permission only to display this image to its users.
Additional permissions should be obtained from the applicable author or publisher of the image.
Full text @ J. Neurophysiol.

