
IMAGE
Fig. 1
- ID
- ZDB-IMAGE-221122-8
- Publication
- Treffy et al., 2021 - Neuroblastoma differentiation in vivo excludes cranial tumors
- All Figures
- Figures for Treffy et al., 2021
Image
|
Figure Caption
Fig. 1
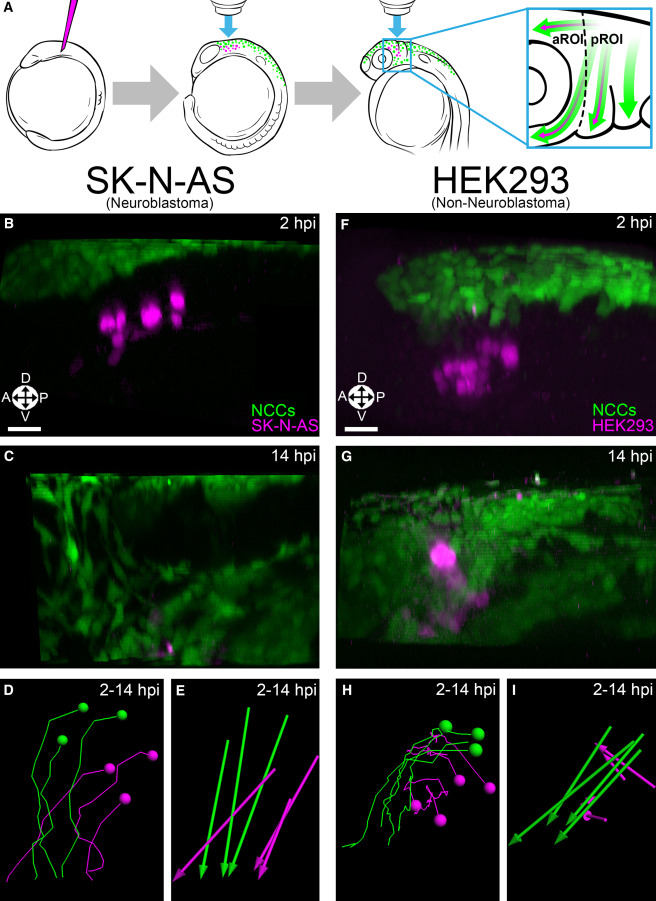
(A) Schematic representation of the procedure used to study NB in live zebrafish embryos. Dotted line divides the aROI and pROI, and arrows indicate NC (green) and NB (purple) migration.
(B and C) 3D projections of Hoechst 34580-labeled (nuclear) injected SK-N-AS NB cells (purple; n = 8 embryos) alongside NCCs (green) at 2 hpi (premigratory) (B) and 14 hpi (C) in zebrafish embryos.
(D and E) SK-N-AS cell tracks (D) and displacements (E) at 2–14 hpi.
(F and G) 3D projections of Hoechst 34580-labeled HEK293 cells (n = 5 embryos) alongside NCCs at 2 hpi (F) and 14 hpi (G). HEK293 cell tracks (H) and displacements (I) at 2–14 hpi. Orientation: A: anterior; P, posterior; L, lateral; D, dorsal; V, ventral. Scale bar (B–I), 30 μm.
Acknowledgments
This image is the copyrighted work of the attributed author or publisher, and
ZFIN has permission only to display this image to its users.
Additional permissions should be obtained from the applicable author or publisher of the image.
Reprinted from Developmental Cell, 56(19), Treffy, R.W., Rajan, S.G., Jiang, X., Nacke, L.M., Malkana, U.A., Naiche, L.A., Bergey, D.E., Santana, D., Rajagopalan, V., Kitajewski, J.K., O'Bryan, J.P., Saxena, A., Neuroblastoma differentiation in vivo excludes cranial tumors, 2752-2764.e6, Copyright (2021) with permission from Elsevier. Full text @ Dev. Cell