
IMAGE
Fig. 5
- ID
- ZDB-IMAGE-221122-12
- Publication
- Treffy et al., 2021 - Neuroblastoma differentiation in vivo excludes cranial tumors
- All Figures
- Figures for Treffy et al., 2021
Image
|
Figure Caption
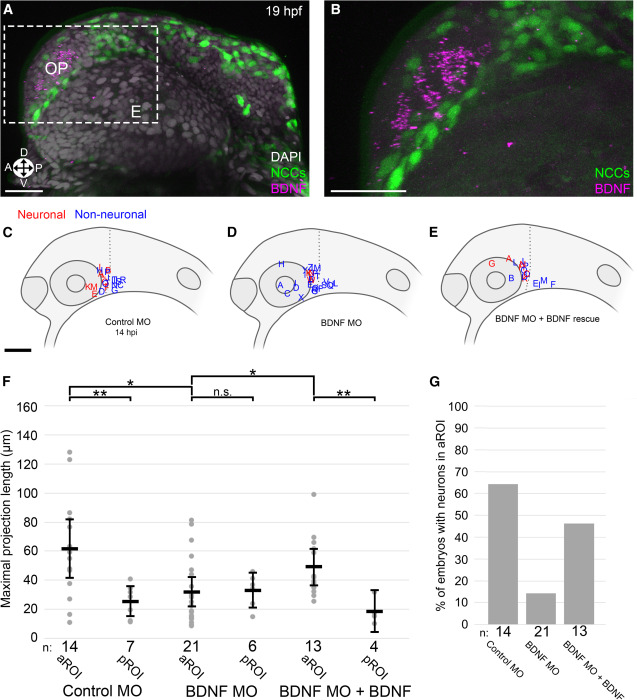
Fig. 5
(A and B) Representative 3D projection of BDNF HCR (purple), NCCs (green), and DAPI nuclear labeling (gray) (A) with inset (B) (gray) in 19 hpf zebrafish embryos, corresponding developmentally to 5 hpi. E, eye; OP, olfactory placode; Orientation: A, anterior; P, posterior; D, dorsal; V, ventral.
(C–E) Lateral view schematics of zebrafish embryos at 14 hpi that were injected with membrane-localized mCherry-expressing SK-N-AS NB cells after injection at the 1-cell stage with (C) 5 ng control morpholino (MO), (D) 2 ng BDNF translation-blocking MO, or (E) 2 ng BDNF translation-blocking MO + 200 ng/mL human BDNF starting at 4 hpf. Red and blue labels indicate final locations of neuronal and non-neuronal cells, respectively.
(F) Scatter plot of maximal projection lengths segregated into aROI and pROI. Horizontal bars denote mean values, with 95% confidence intervals indicated. n.s. p > 0.05, ∗p < 0.05, ∗∗p < 0.01.
(G) Percentage of embryos in which SK-N-AS cells differentiated into neurons in the aROI. Scale bar (A and B), 20 μm. Scale bar (C–E), 100 μm.
Acknowledgments
This image is the copyrighted work of the attributed author or publisher, and
ZFIN has permission only to display this image to its users.
Additional permissions should be obtained from the applicable author or publisher of the image.
Reprinted from Developmental Cell, 56(19), Treffy, R.W., Rajan, S.G., Jiang, X., Nacke, L.M., Malkana, U.A., Naiche, L.A., Bergey, D.E., Santana, D., Rajagopalan, V., Kitajewski, J.K., O'Bryan, J.P., Saxena, A., Neuroblastoma differentiation in vivo excludes cranial tumors, 2752-2764.e6, Copyright (2021) with permission from Elsevier. Full text @ Dev. Cell