
|
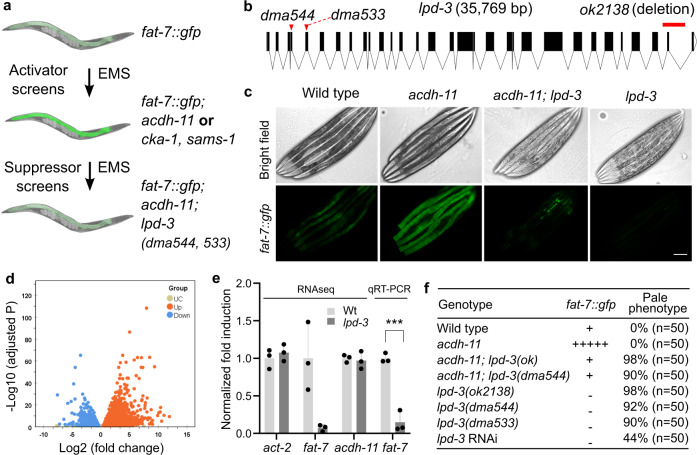
Fig. 1 a Schematic of genetic screens that led to the identification of acdh-11, cka-1, and sams-1 as negative regulators of fat-7 and acdh-11-suppressing lpd-3 as positive regulator of fat-7. b Full-length gene diagram of lpd-3 with the point mutations dma544, dma533 (arrows) and deletion mutation ok2138 (line). c Representative images of fat-7::GFP animals in wild type, acdh-11(n5857) single, acdh-11(n5857); lpd-3(ok2138) double, or lpd-3(ok2138) single mutants. Scale bar, 50 µm. d Volcano plot showing significantly (adjusted p value < 0.05, Wald test in DESeq2) up- (orange) or down- (blue) regulated genes in lpd-3 mutants compared with wild type. e Normalized fold induction (RNAseq and qRT-PCR) of fat-7 showing its diminished expression in lpd-3 mutants. Values are means ± S.D. ***P < 0.001 (N = 3 biological replicates, P = 0.0006 from two-sided unpaired t-test). f Table summary of fat-7::GFP abundance (indicated by relative numbers of plus signs based on fluorescent intensities or minus sign, no signals) and the morphological pale phenotypes in animals with indicated genotypes (single, double mutations or RNAi) and phenotypic penetrance. Source data are provided as a Source Data file.