
|
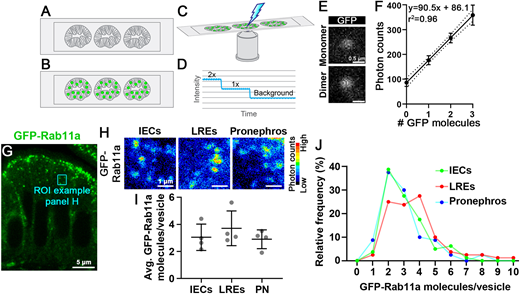
Fig. 4 Tissue-specific Rab11a expression levels do not strongly affect its concentration on apical vesicles of the intestine or pronephros. (A-F) Single particle imaging of zebrafish tissue sections. Intestinal sections of GFP-negative larvae (A) are incubated with purified eGFP (B), and photon counts are collected and photobleached to background-level intensity (C). eGFP particle concentrations are inferred by the decay profile (D). (E,F) Single particle photon count imaging and linear regression analysis of purified eGFP photon emission from intestinal sections. (G) Transverse section of TgKI(eGFP-rab11a)pd1244 intestinal epithelial cells (IECs). Cyan box shows a representative region of interest of apical vesicles. (H) Pseudo-colored photon count images of apical vesicles of IECs, lysosome-rich enterocytes (LREs) and pronephric duct epithelial cells (PN). (I) Average eGFP-Rab11a concentration values from apical vesicles. Data points are mean values from tissue sections of individual larvae. Error bars show s.d. n=4 larvae for each organ (20 vesicles per animal). Data were not significantly different (one-way ANOVA). (J) Relative frequency plot of the data used for I. LREs versus IECs, P<0.05; LREs versus PN, P<0.01; IECs versus PN, not significant (one-way ANOVA). n=80 vesicles per organ. Scale bars: 0.5 µm (E); 5 µm (G); 1 µm (H).