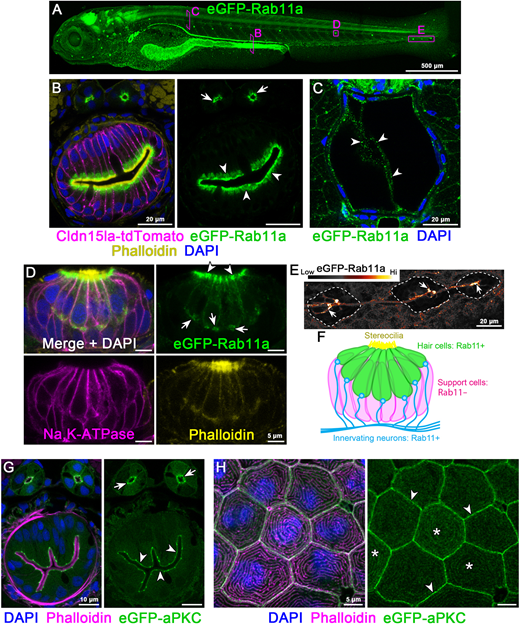
Fig. 3 Endogenous N-terminal tagging of Rab11a and aPKC. (A) Live 3D reconstruction of 5 dpf TgKI(eGFP-rab11a)pd1244 heterozygous larva. Magenta boxes show representative regions of interest for panels B-E. (B) Transverse section through the posterior mid-intestine (LREs, arrowheads) and pronephric ducts (arrows). (C) Transverse section through the notochord. Arrowheads, notochord vacuolated cells. (D) Whole-mount image of a neuromast. Arrowheads, apical cytoplasm; arrows, basal cytoplasm. (E) Live image of neurons innervating lateral line neuromasts (dotted line). Image is pseudo-colored according to the LUT scale shown. Arrows, neuronal tracts. (F) Schematic of Rab11a expression within neuromasts. (G,H) Transverse sections of TgKI(eGFP-prkci)pd1260 heterozygous larvae. (G) Transverse section of the mid-intestine. Arrowheads, IEC apical cortex; arrows, pronephric duct apical cortex. (H) Localization of eGFP-aPKC in periderm cells. Arrowheads, cell cortex; asterisks, apical microridges. Scale bars: 500 µm (A); 20 µm (B,C,E); 5 µm (D,H); 10 µm (G).
Image
Figure Caption
Acknowledgments
This image is the copyrighted work of the attributed author or publisher, and
ZFIN has permission only to display this image to its users.
Additional permissions should be obtained from the applicable author or publisher of the image.
Full text @ Development

