
Fig. 10
- ID
- ZDB-IMAGE-221115-24
- Publication
- Silic et al., 2021 - Phylogenetic and developmental analyses indicate complex functions of Calcium-Activated Potassium Channels in zebrafish embryonic development
- All Figures
- Figures for Silic et al., 2021
|
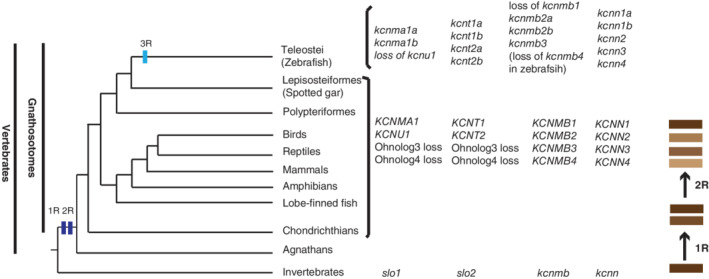
Fig. 10
Model of vertebrate KCa genes' evolutionary history. The phylogenetic relationships of vertebrata are based on our col2a1 and kank genes' phylogenetic analyses. 23 , 53 , 54 The branch lengths are not proportional to the time of diversification. The two vertical dark blue bars on the tree indicate the WGD events (R1 and R2) at the origin of the vertebrates. The light blue vertical bar represents the teleost specific WGD. The process of gene duplication and diversification through WGD is illustrated by the brown bars on the far‐right side of the illustration. The representative KCa genes present in the vertebrates that are listed on the right side of these taxa. The presence of these genes may be variable in specific species, as exemplified by the loss of kcnmb4 in zebrafish, but not in other teleost species