
|
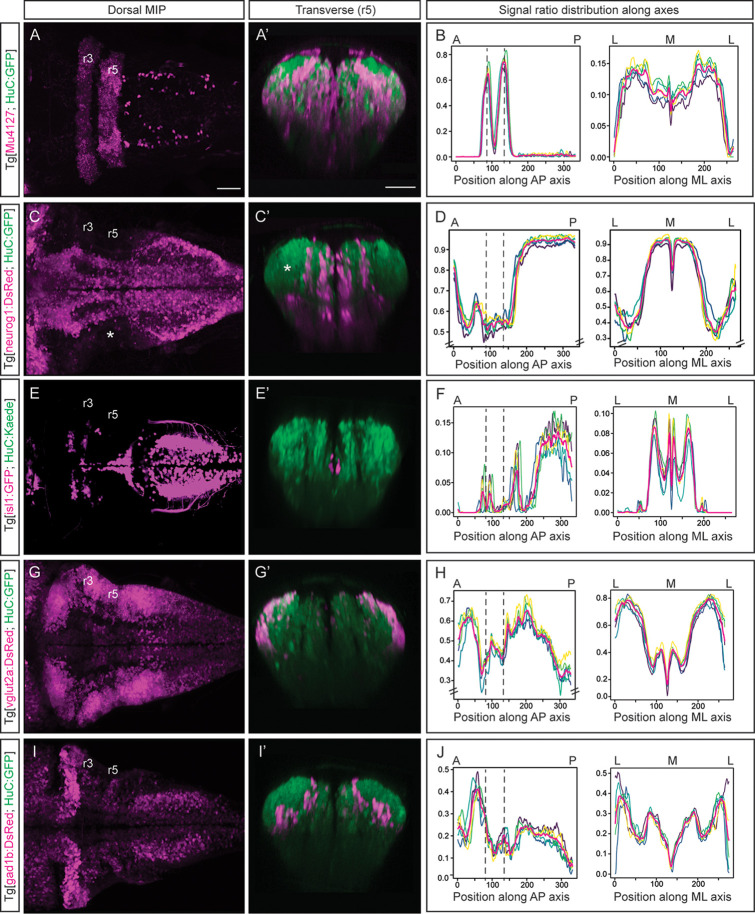
Figure 2
(A, C, E, G, I) Dorsal maximal intensity projections (MIP) with anterior to the left, and (A’, C’, E’, G’, I’) transverse views through r5 of registered embryos, in the Tg[HuC:GFP] background (72hpf). (A, C, E, G, I) display only the magenta signals such as r3 and r5 (Mu4127), neurog1, isl1, vglut2a and gad1b, whereas (A’, C’, E’, G’, I’) display these signals and the HuC (green). Scale bar, 50μm. (B, D, F, H, J) Signal ratio distribution along the anteroposterior (AP) and mediolateral (ML) axes of different individual embryos (n=5; colored lines), with the average value displayed as magenta line. Position along the AP and ML body axes is indicated on the top of the graph. Black dashed lines parallel to the Y-axis correspond to r3 and r5 positions assessed by Mu4127 signal. Note in (D, H) the offset in the Y-axis for easier readability of the signal variations. Scale bar, 50μm.
Incorporating territory landmarks allows precise spatial characterization of signals.