
|
Fig. 3
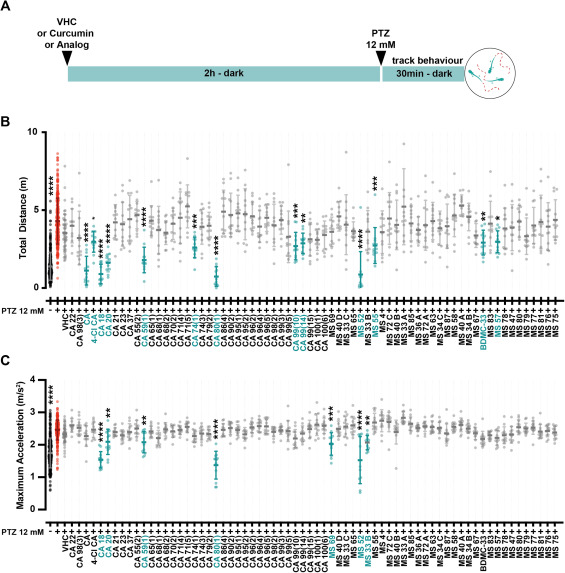
Fig. 3. In vivo screening of 68 curcumin analogs on PTZ-induced acute seizures (A) Timeline of the experimental procedure corresponding to our PTZ behavioural hyperactivity assay. (B & C) Quantification of the total distance travelled (m) and maximum acceleration (m/s2) respectively of 5 dpf zebrafish larvae treated or not with PTZ 12 mM and pre-incubated or not with analogues. The analogues were applied at a concentration of 5 µM except for several analogues that were applied at 4 µM (MS 65), 3 µM (MS 72 C and MS 40 B), 2 µM (CA 22, CA 98(3), MS 55, MS 4 and MS 33 A), 1 µM (MS 52) and 0.5 µM (MS 33 C) due to their toxicity to zebrafish larvae at higher concentrations. Green indicates significant changes with the * , * *, * ** and * ** * markers denoting significance at P < 0.05, P < 0.01, P < 0.001 and P < 0.0001 respectively as compared to the 12 mM PTZ only group using one-way ANOVA followed by Dunnett's post hoc test.