
|
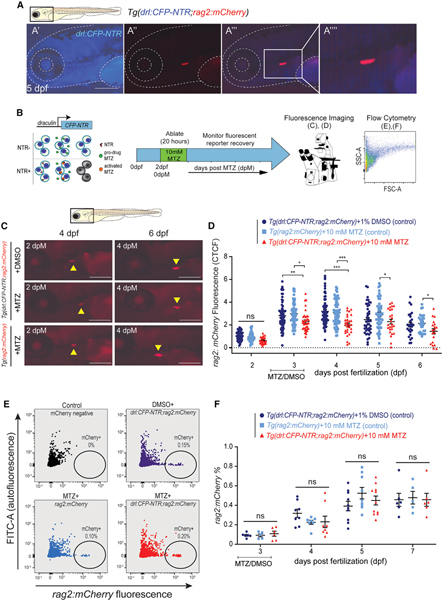
Fig. 6
(A) Fluorescent images of drl:CFP-NTR (A′), rag2:mCherry (marking T-lymphocytes) (A′′) and merged (A′′′) at 5 dpf in the thymic lymphoid tissue. Scale bars, 500 μm. Merged fluorescent image (A′′′′) shows higher magnification image of (A′′′).
(B) Experimental schema of the NTR/MTZ system.
(C) Fluorescent images of Tg(drl:CFP-NTR+; rag2:mCherry+) and Tg(rag2:mCherry+) larvae shown at 4 and 6 dpf (2 and 4 dpM, respectively) after depletion of HSCs using the NTR/MTZ system. Yellow arrowheads indicate rag2:mCherry+ fluorescent lymphocytes within the thymus. Scale bars, 500 μm.
(D) Quantification of rag2:mCherry fluorescence CTCF levels in Tg(drl:CFP-NTR+;rag2:mCherry+) and Tg(rag2:mCherry+) zebrafish treated with 10 mM MTZ or 1% DMSO (n = 19–72 larvae).
(E) Flow cytometry plots of rag2:mCherry and FITC (autofluorescence control) in untreated negative controls (black); Tg(drl:CFP-NTR;rag2:mCherry) + 1% DMSO (purple); Tg(rag2:mCherry) + 10 mM MTZ (light blue); and Tg(drl:CFP-NTR;rag2:mCherry) + 10 mM MTZ (red).
(F) Quantification of rag2:mCherry% from (E) flow cytometry experiments in treated and control groups; n = 4–11, 7–10 pooled larvae per sample.
Two-way ANOVA with Tukey’s multiple comparisons test was used for all statistical analyses. Plots are individual data points for each biological replicate with mean ± SEM. ns, not significant; *p < 0.05; **p ≤ 0.01; ***p ≤ 0.001.