
|
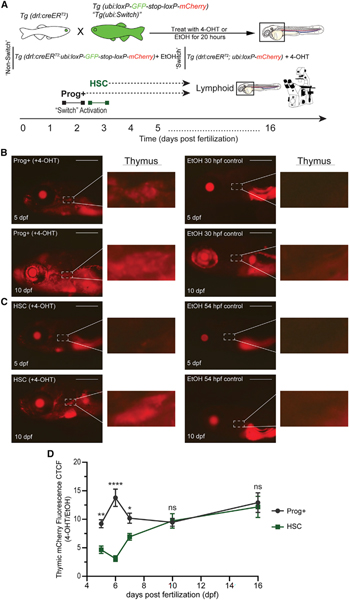
Fig. 3
(A) Experimental schema of 4-OHT-inducible lineage tracing to examine larval T cell production in the thymus from Prog+− and HSC-labeled cohorts.
(B and C) Fluorescent images of 4-OHT-induced switch (left) and EtOH non-switched controls (right) Tg(drl:creERT2;ubi:Switch) larvae for Prog+ (B) and HSC (C) populations. Top images are 5 dpf larvae, and bottom images are 10 dpf larvae. Dashed box and inset showing the thymus where T cells colonize. mCherry+ fluorescence corresponds to drl+ switched daughter cells. Scale bars, 500 μm. Representative images are shown, with quantification in (D).
(D) Quantification of mCherry fluorescence intensity in the thymic region in larvae of Prog+− and HSC-labeled cohorts measured over a time course of 5–16 dpf. Mean ± SEM of the mCherry+ corrected total cell fluorescence (CTCF) at each time point is shown. Two-way ANOVA with Sidak’s multiple comparison (n = 6–30 per larvae/day). *p ≤ 0.05; **p ≤ 0.01; ****p ≤ 0.0001. See also Figure S3.