
|
Fig. 2
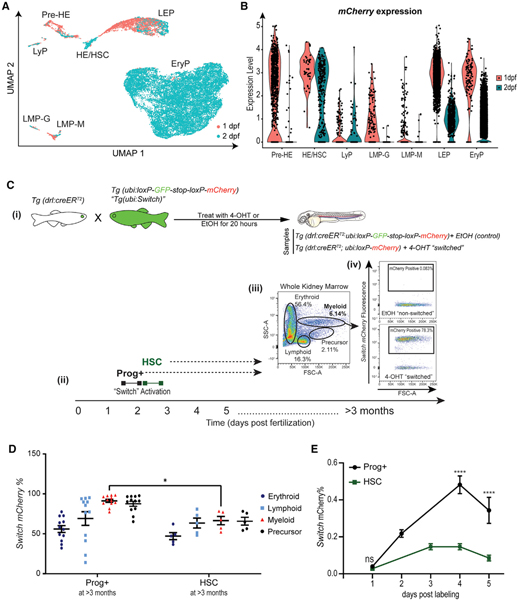
(A) UMAP dimensional reduction and unsupervised clustering of drl:mCherry+;gata1:GFP− cells at 1 and 2 dpf showing their original collection time point.
(B) mCherry expression level driven by the drl promoter for the different cell types collected at 1 and 2 dpf.
(C) (i) Schematic illustrating drl-specific, 4-OHT-inducible lineage-tracing system. Tg(drl:creERT2) homozygous transgenic fish were crossed with hemizygous ubi:loxP-GFP-stop-loxP-mCherry (ubi:Switch). (ii) Zebrafish embryos were exposed to 12 μM 4-OH-tamoxifen (4-OHT) or ethanol (EtOH) vehicle control for 20 h starting at either 30 hpf (labeled as Prog+, which includes embryonic progenitors and HSCs) or 54 hpf (labeled as HSC). Those embryos exposed to 4-OHT induce Cre recombination of loxP sites, leading to a permanent “switch” excising the GFP cassette and resulting in expression of mCherry fluorescence. The resulting mCherry+ cells are the descendants of Prog+− and HSC-labeled cells. (iii) Representative flow cytometry analysis: forward (FSC) and side scatter (SSC) parameters were used to define the major blood cell populations (erythroid, myeloid, lymphoid, and precursor) in whole kidney marrow (WKM) (>3 months). (iv) The frequency of mCherry+ cells within each cell lineage was then calculated. Example flow cytometry plots (right) of mCherry contribution to the myeloid population. Gates were set based on EtOH-treated “non-switched” controls.
(D) Quantification of mCherry+ percentage from experimental groups Prog+ and HSCs within each blood cell lineage found in WKM at >3 months post-fertilization (zebrafish adulthood). Data points represent individual zebrafish WKM with mean ± SEM (n = 5–12).
(E) Quantification of mCherry+ percentage at 1–5 days post-labeling in Prog+ and HSC-labeled cohorts. n = 5–11 samples, 7–10 pooled larvae per sample. Two-way ANOVA with Sidak’s multiple comparison test was used for analysis (mean ± SEM). *p < 0.05; ****p ≤ 0.0001. See also Figure S2.