
|
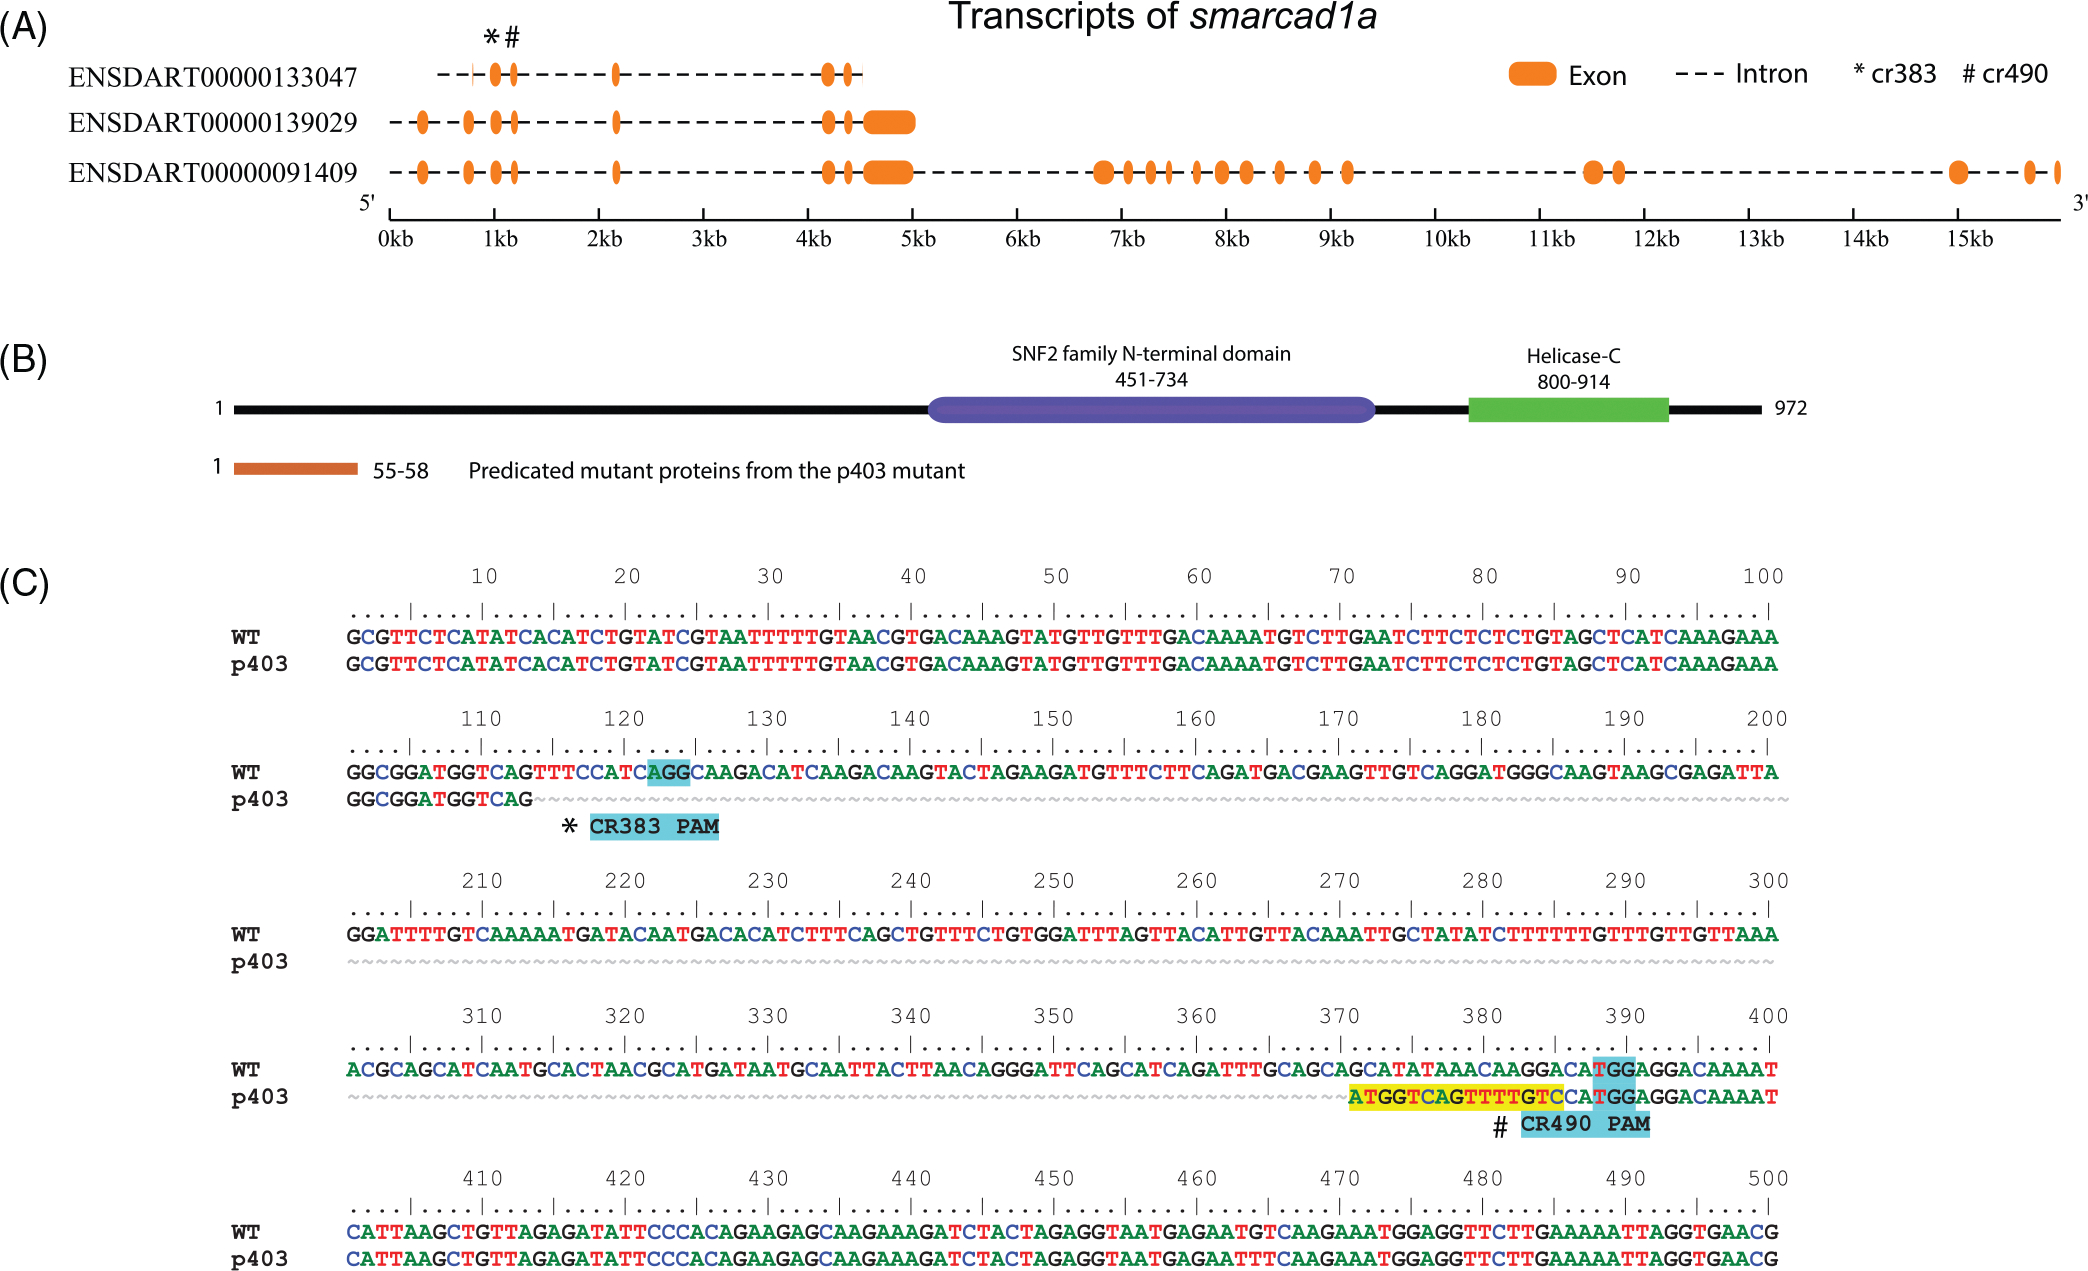
Fig. 7
Zebrafish smarcad1a mutant created by CRISPR. (A) Transcripts of the smarcad1a gene, according to Ensembl (GRCz11). (B) Diagram of consequences of the p403 mutant on the SMARCAD1A protein. The top is the intact protein, and the bottom is the truncated protein. Protein domains were predicted by SMART domain. (C) Sequencing result of the smarcad1a p403 allele compared with wildtype (WT). The PAMs were highlighted in cyan, and the positions of CRISPR gRNAs are underneath the PAM sequences. The yellow highlighted nucleotides are the insertion. There is a 329 bps deletion from position 114 to 382 in the diagram. The tildes (~) represent deleted sequences. Asterisk (*) and hashtag (#) indicate the gRNA CR383 and CR490, respectively