
|
Figure 1
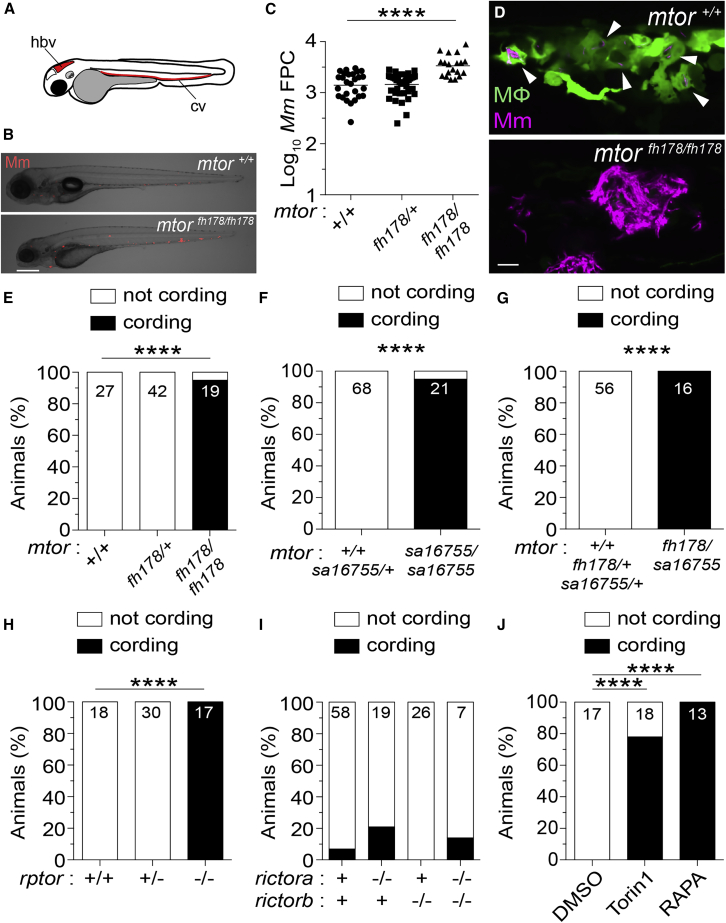
mTORC1-deficient zebrafish are hypersusceptible to Mm infection
(A) Hindbrain ventricle (hbv) and caudal vein (cv) injection routes used in this study.
Larvae were infected with ∼150 Mm expressing tdTomato (B), (C), and (E–J) or tdKatushka2 (D) fluorescent proteins via the caudal vein 2 days post-fertilization (dpf).
(B) Overlaid micrographs of widefield mycobacterial fluorescence (Mm, red) and bright field in
(C) Quantification of bacterial fluorescence (fluorescent pixel counts [FPCs]) in animals from
(D) Confocal micrograph optical sections of
(E–J) Mycobacterial cording in animals from (E)
(E–J) Numbers within columns indicate animals per group.
Scale bars: 300 μm in (B) and 25 μm in (D). Statistical analyses, (C) one-way ANOVA with Tukey’s post-test and (E–J) Fisher’s exact test. Data are representative of two or more independent experiments.
Reprinted from Cell, 185(20), Pagán, A.J., Lee, L.J., Edwards-Hicks, J., Moens, C.B., Tobin, D.M., Busch-Nentwich, E.M., Pearce, E.L., Ramakrishnan, L., mTOR-regulated mitochondrial metabolism limits mycobacterium-induced cytotoxicity, 3720-3738.e13, Copyright (2022) with permission from Elsevier. Full text @ Cell