
|
Figure 6
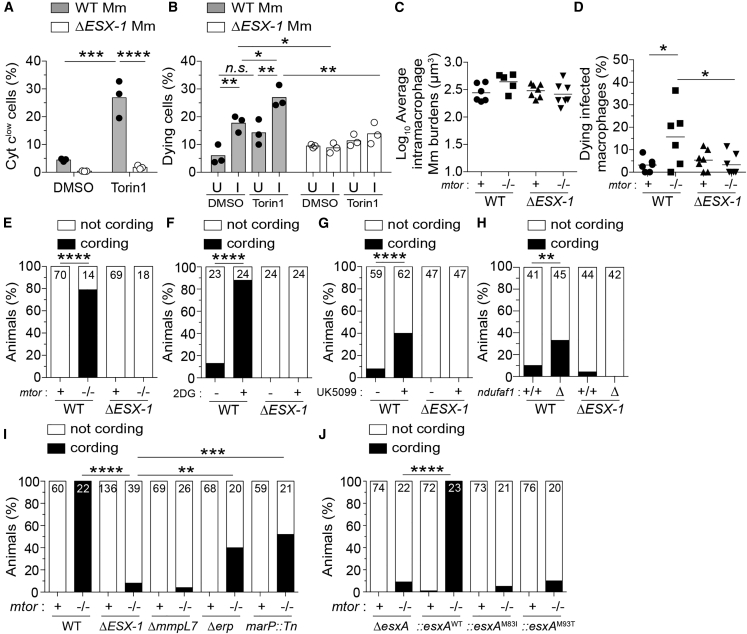
Deficiencies in mTOR, glycolysis, and OXPHOS sensitize macrophages to mycobacterial ESAT-6-dependent cytotoxicity
(A) Cytochrome
(B) Percentage of dying cells (Sytox Green+) during 4-h time-lapse at 1 dpi with tdTomato-expressing WT or Δ
(C–J) Zebrafish were infected with dose-matched inocula of tdTomato-expressing Mm of the indicated strains via the caudal vein.
(C) Intramacrophage Mm burdens at the beginning of 6-h time-lapse confocal microscopy of
(D) Percentage of dying infected macrophages in same experiment shown in (C). See
(E) Cording in
(F and G) Cording in WT zebrafish treated with 2DG, UK5099, or DMSO 5 dpi.
(H) Cording in
(I) Cording in
(J) Cording in
Symbols represent values from individual (A) wells, (B) imaging fields, or (C) animals. (A and B) Bars and (C and D) horizontal lines indicate mean values. (E–J) Numbers within columns indicate animals per group. Statistical analyses, (A–D) one-way ANOVA with Sidak’s post-test or (E–J) Fisher’s exact test. (B, E, and H) Data are representative of two experiments. Zebrafish time-lapse data were pooled from four experiments.
See also
Reprinted from Cell, 185(20), Pagán, A.J., Lee, L.J., Edwards-Hicks, J., Moens, C.B., Tobin, D.M., Busch-Nentwich, E.M., Pearce, E.L., Ramakrishnan, L., mTOR-regulated mitochondrial metabolism limits mycobacterium-induced cytotoxicity, 3720-3738.e13, Copyright (2022) with permission from Elsevier. Full text @ Cell