
|
Figure 3
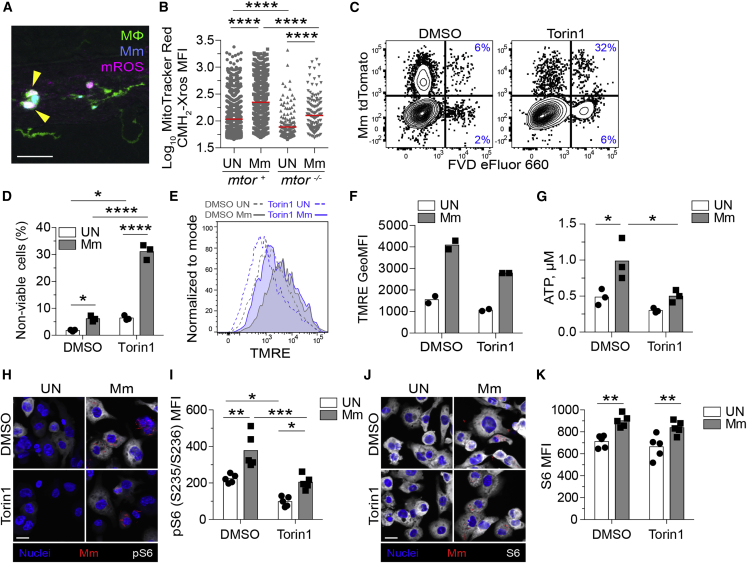
mTOR deficiency impairs basal and mycobacterium-stimulated mitochondrial metabolism in macrophages
(A and B)
(A) Confocal micrograph illustrating mROS detection in an infected animal. Macrophages (green), Mm (blue), mROS (magenta), mROS-producing infected cells (arrowheads). Scale bar, 20 μm.
(B) MitoTracker Red CMH2-Xros mean fluorescence intensity (MFI) in infected and uninfected macrophages of
(C–K) THP-1 macrophages were treated with torin1 or DMSO and infected with (C, D, G, and H–K) tdTomato- or (E and F) mWasabi-expressing Mm at a multiplicity of infection (MOI) of 1 (C–F) or 3 (G and H–K).
(C) Flow cytometry plots of cell viability 2 dpi. Percentages of non-viable cells (FVD eFluor 660+) in the infected and uninfected subpopulations are shown.
(D) Quantification of non-viable cells. Symbols represent values from individual wells. Bars indicate mean values.
(E) Flow cytometry histograms of TMRE fluorescence 1 dpi.
(F) TMRE geometric mean fluorescence intensities (GeoMFIs) 1 dpi. Symbols represent values from individual wells. Bars indicate mean values.
(G) ATP concentration per well containing 106 THP-1 macrophages 1 dpi.
(H–K) 1 dpi THP-1 macrophage cultures infected with tdTomato-expressing Mm (MOI = 2) were treated with torin1 or DMSO for 4 h in serum-free media.Confocal micrographs depicting Hoechst-stained nuclei (blue), Mm (red), and (H) phospho-S6S235/S236 or (J) total S6 staining (white). Scale bars, 20 μm.
(I and K) Mean fluorescent intensity (MFI) of (I) phospho-S6S235/S236 and (K) total S6 staining in uninfected and infected cells. Bars indicate group means. Symbols depict average MFI per field.
Statistical analyses, (B) one-way or (D), (G), (I), and (K) two-way ANOVA with Tukey’s post-test. (A), (B), and (H–K) Data are representative of two experiments.
See also
Reprinted from Cell, 185(20), Pagán, A.J., Lee, L.J., Edwards-Hicks, J., Moens, C.B., Tobin, D.M., Busch-Nentwich, E.M., Pearce, E.L., Ramakrishnan, L., mTOR-regulated mitochondrial metabolism limits mycobacterium-induced cytotoxicity, 3720-3738.e13, Copyright (2022) with permission from Elsevier. Full text @ Cell