
|
Figure 2
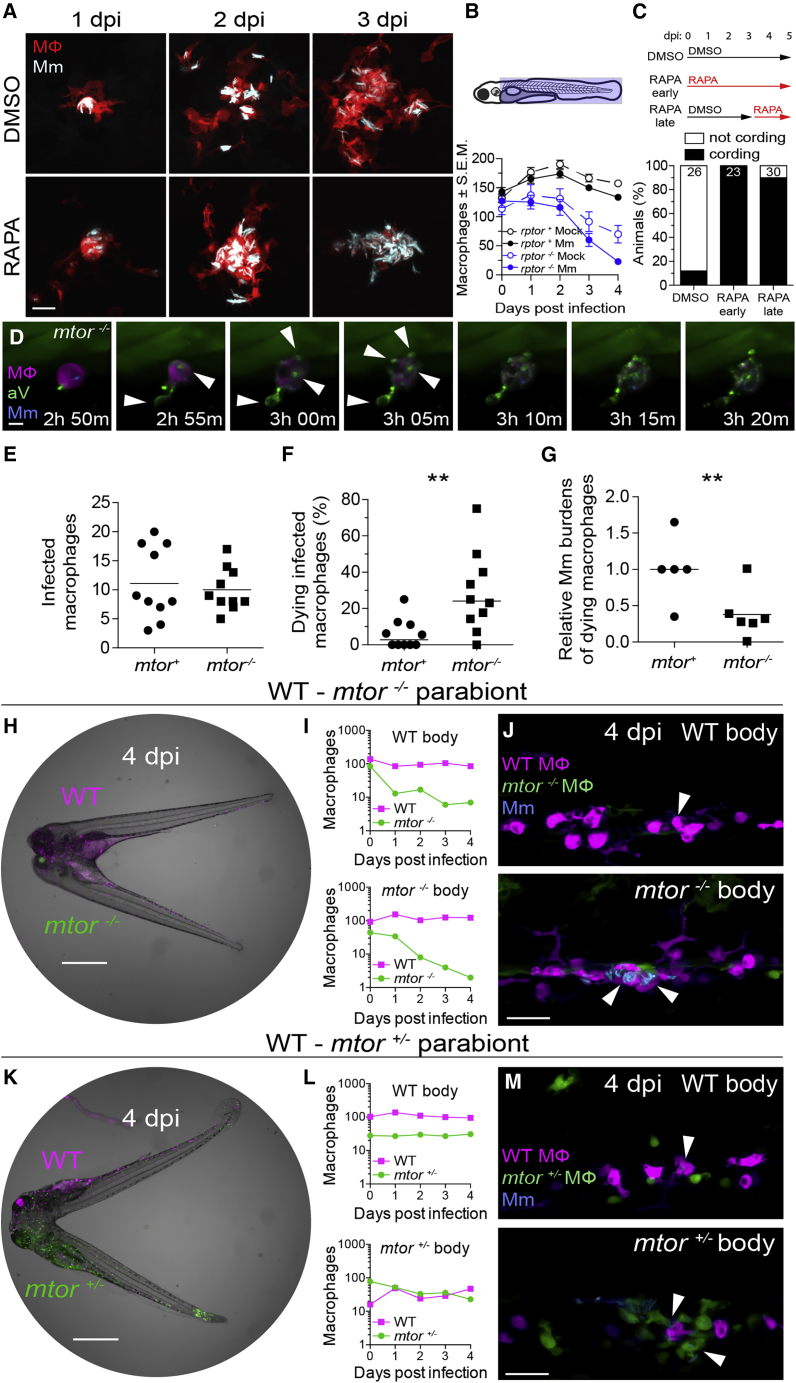
mTOR deficiency impairs macrophage development and survival and sensitizes infected macrophages to mycobacterium-induced cytotoxicity
Larvae were infected with Mm expressing BFP2 (A), (E), and (I–N), mWasabi (C and D), or tdKatushka2 (F–H) fluorescent proteins via the hindbrain ventricle (A) or the caudal vein (B–N) 2 dpf.
(A) Serial confocal micrographs of granulomas in
(B) (Top) Macrophage counting region (shaded light blue). (Bottom) Numbers of macrophages in Mm- and mock-infected Raptor mutants and siblings expressing
(C) (Top) Duration of rapamycin and DMSO treatments. (Bottom) Mycobacterial cording 5 dpi.
(D) Time-lapse confocal micrographs of a dying infected macrophage in an
(E–G) 6-h time-lapse confocal microscopy of
(E) Absolute numbers of infected macrophages per field.
(F) Percentage of dying infected macrophages per field.
(G) Relative mycobacterial burdens in dying macrophages of
(H) Widefield micrograph of parabiotic zebrafish comprised of conjoined WT
(I) Absolute numbers of macrophages in the WT body (top) and
(J) Maximum intensity projections of infections in the WT body (top) and
(K) Widefield micrograph of WT
(L) Absolute numbers of macrophages in the WT body (top) and
(M) Maximum intensity projections of infections in the WT body (top) and
Scale bars: 25 μm in (A), 10 μm in (D), 400 μm in (H) and (K), and 50 μm in (J) and (M). Horizontal lines indicate mean (E) and (G) or median (F) values. Statistical analyses, (E–G) two-tailed, unpaired Student’s t test. Time lapse data were pooled from five (E and F) or three (G) independent experiments.
See also
Reprinted from Cell, 185(20), Pagán, A.J., Lee, L.J., Edwards-Hicks, J., Moens, C.B., Tobin, D.M., Busch-Nentwich, E.M., Pearce, E.L., Ramakrishnan, L., mTOR-regulated mitochondrial metabolism limits mycobacterium-induced cytotoxicity, 3720-3738.e13, Copyright (2022) with permission from Elsevier. Full text @ Cell