
Image
|
Figure Caption
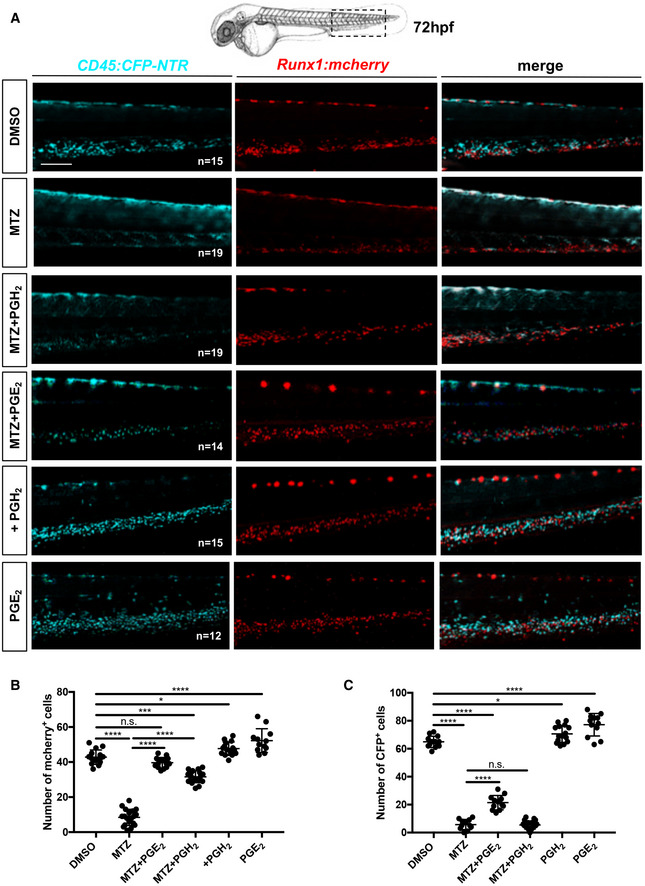
Fig. 2
The loss of HSCs after myeloid ablation can be rescued by PGE2 or PGH2 treatments
- ASchematic indicating the imaging area in the tail at 72 hpf, as indicated by the black box; fluorescence imaging of the CHT in double transgenic cd45:CFP‐NTR/runx1:mcherry embryos in DMSO and after treatment with MTZ and PGH2 or PGE2.
- BQuantification of runx1:mcherry‐positive cells in double transgenic cd45:CFP‐NTR/runx1:mcherry embryos in DMSO and after treatment with MTZ and PGH2 or PGE2.
- CQuantification of cd45:CFP‐positive cells in double transgenic cd45:CFP‐NTR/runx1:mcherry embryos in DMSO and after treatment with MTZ and PGH2 or PGE2.
Data information: Statistical analysis was completed using one‐way ANOVA and multiple comparison tests. *P < 0.05; **P < 0.01; ***P < 0.001; ****P < 0.0001. Scale bar is 200 μm (A).
Source data are available online for this figure.
Figure Data
Acknowledgments
This image is the copyrighted work of the attributed author or publisher, and
ZFIN has permission only to display this image to its users.
Additional permissions should be obtained from the applicable author or publisher of the image.
Full text @ EMBO J.