
|
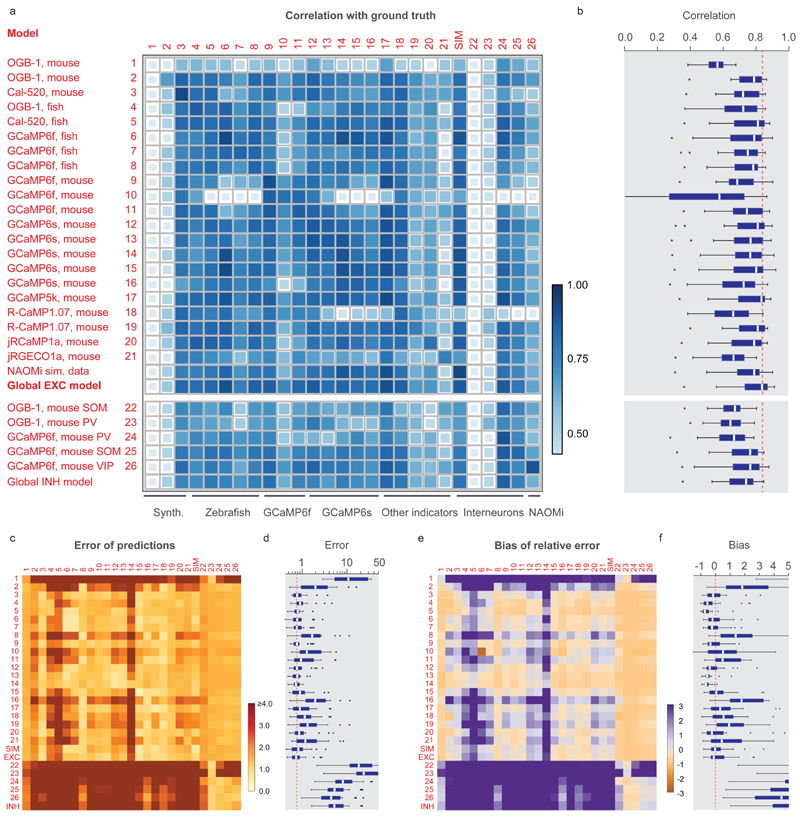
Fig. 3
The network was trained on a given dataset (indicated by the row number) and tested on each other ground truth dataset (column). Diagonal values correspond to metrics shown in Fig. 3e. "NAOMi” is a model trained on simulated GCaMP6f data based on Charles et al. (2019). Rows 21-24 are networks trained on datasets with inhibitory neurons. "Global EXC model” and "global INH model” are globally trained on all excitatory or inhibitory datasets (except datasets #01 and the respective test dataset). a, Correlation of predictions with the ground truth. The size and color of the squares scale with correlation. b, Distribution of the performance of each trained network (row) across all other datasets (distribution across n=25 datasets for each box plot). The dashed line highlights the median of the best-performing model (‘global EXC model’). c-d, Relative error of predictions compared to the ground truth. The dashed line in (d) highlights the median of the best-performing mode (‘global EXC model’). e-f, Relative bias of predictions compared to the ground truth (distribution across n=25 datasets for each box plot). All datasets were re-sampled at a frame rate of 7.5 Hz, with a standardized noise level of 2. For box plots, the median is indicated by the central line, 25th and 75th percentiles by the box, and maximum/minimum values excluding outliers (points) by the whiskers.