
|
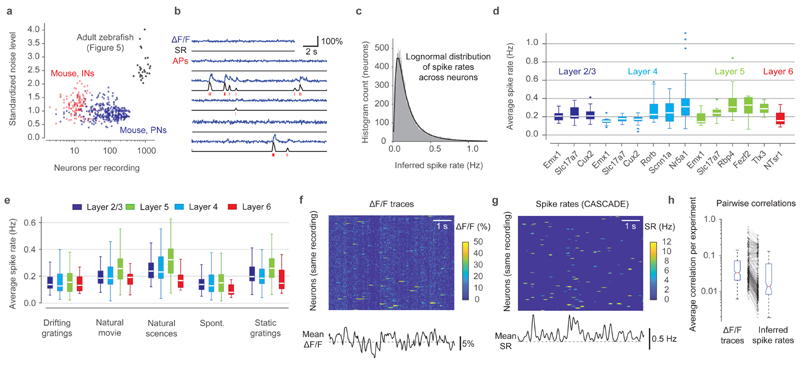
Fig. 6
a, Number of recorded neurons vs. standardized noise levels (in % · Hz −1/2) for all experiments from dataset from excitatory (blue) and inhibitory (red) datasets; population imaging datasets in zebrafish (Fig. 5) in black for comparison. b, Example predictions from calcium data (blue). Discrete inferred spikes are shown in red below the inferred spike rates (black). See Extended Data Fig. 10 for more examples. c, Spike rates across the entire population are well described by a log-normal distribution (black fit). n = 38,466 neurons. d, Inferred spike rates across all neurons for recordings in different layers (colors) and for different transgenic driver lines of excitatory neurons. Each underlying data point is the mean spike rate across an experiment (n=336 experiments). e, Average spike rates for different stimulus conditions (x-labels) across layers (colors). Each data point is the mean spike rate across one experiment. f, Excerpt of raw ΔF/F traces of a subset of neurons of a single experiment (L2/3-Slc17a7, experiment ID ‘652989705’). Correlated noise is visible as vertical striping patterns. g, Same as (f), but with inferred spike rates. h, Average correlation between neuron pairs within an experiment (n=336 experiments), computed from raw ΔF/F traces (left) and inferred spike rates (right). For box plots, the median is indicated by the central line, 25th and 75th percentiles by the box, and maximum/minimum values excluding outliers (points) by the whiskers.