
Fig. 7.
- ID
- ZDB-IMAGE-221018-17
- Publication
- Bhandiwad et al., 2022 - A cerebellar-prepontine circuit for tonic immobility triggered by an inescapable threat
- All Figures
- Figures for Bhandiwad et al., 2022
|
Fig. 7.
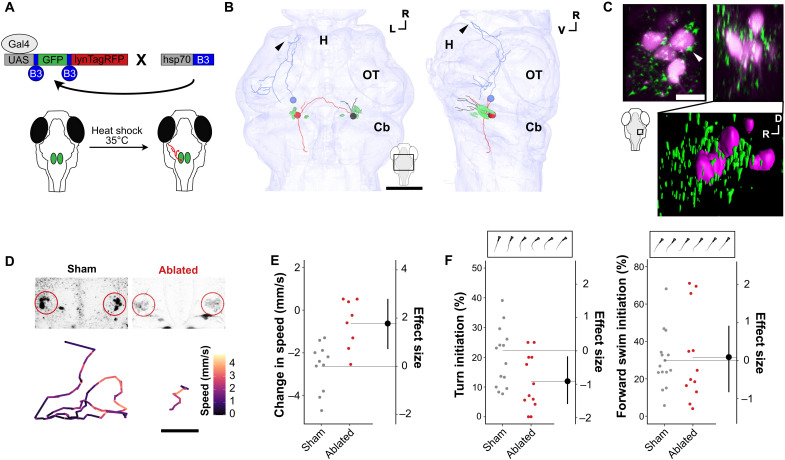
(A) Schematic of intersectional method for sparse labeling of single neurons with membrane-tagged RFP (lynTagRFP) to enable morphological reconstruction. (B) Reconstructed y334-Gal4 vPPNs and RoL1 neurons (green) vPPNs project to ipsilateral (black), contralateral (red), and hypothalamic (blue) targets. Arrowhead: terminal projection in rostral hypothalamus. All neurons can be viewed in fig. S7. Scale bar, 50 μm. H, hypothalamus; OT, optic tectum; Cb, cerebellum. (C) Top: Maximum projection of y334-Gal4;UAS:synaptophysin-RFP (green) and backfilled RoL1 (magenta) colocalization in dorsal (left) and lateral (right) views. White arrowhead: apposition of y334-Gal4 synapses with RoL1 cell body. Scale bar, 10 μm. Bottom: 3D rendering of lateral view showing synapses relative to RoL1 and surrounding neuropil. (D) Top, left: Sham-ablated and (right) multiphoton-ablated RoL1 reticulospinal neurons. Bottom: Baseline movement traces for sham-ablated (left) and RoL1-ablated (right) fish. Color denotes speed within a 5-s epoch. Scale bar, 1 cm. (E) Change in speed (mm/s) after vibratory stimulus in sham-ablated (gray, n = 11 fish) and bilateral RoL1-ablated (red, n = 8 fish). Effect size is Cohen’s d. t test, P = 0.001. (F) Turn initiation (left) and forward swim initiation. t test, P = 0.03. Right: Frequency during baseline locomotion in sham-ablated (gray, n = 14) and RoL1-ablated (red, n = 12) fish. Insets show examples of turn and forward swim bouts.