
|
Fig. 5
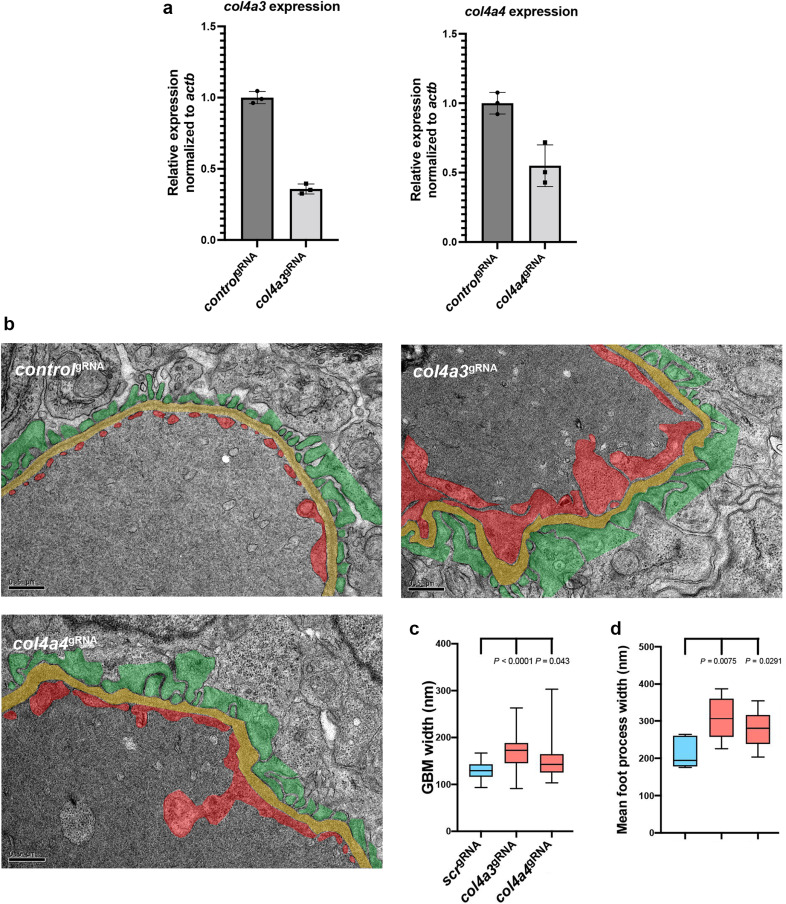
Figure 5. Depletion of col4a3 or col4a4 induces Alport syndrome phenotypes in zebrafish. (a) Bar charts showing real-time reverse transcription–polymerase chain reaction analysis of col4a3 and col4a4 in wild-type versus respective crispant embryos (n = 3). (b) Transmission electron microscopy images of the glomerular filtration barrier in control scr, col4a3, and col4a4 crispants (bar = 500 nm). Podocytes are pseudocolored green, the glomerular basement membrane (GBM) is yellow, and the endothelium is red. (c) Box and whisker plot showing the average GBM width in control scr, col4a3, and col4a4 crispants. (d) Box and whisker plot showing the average foot process width in control scr, col4a3, and col4a4 crispants.