
|
Fig. 3
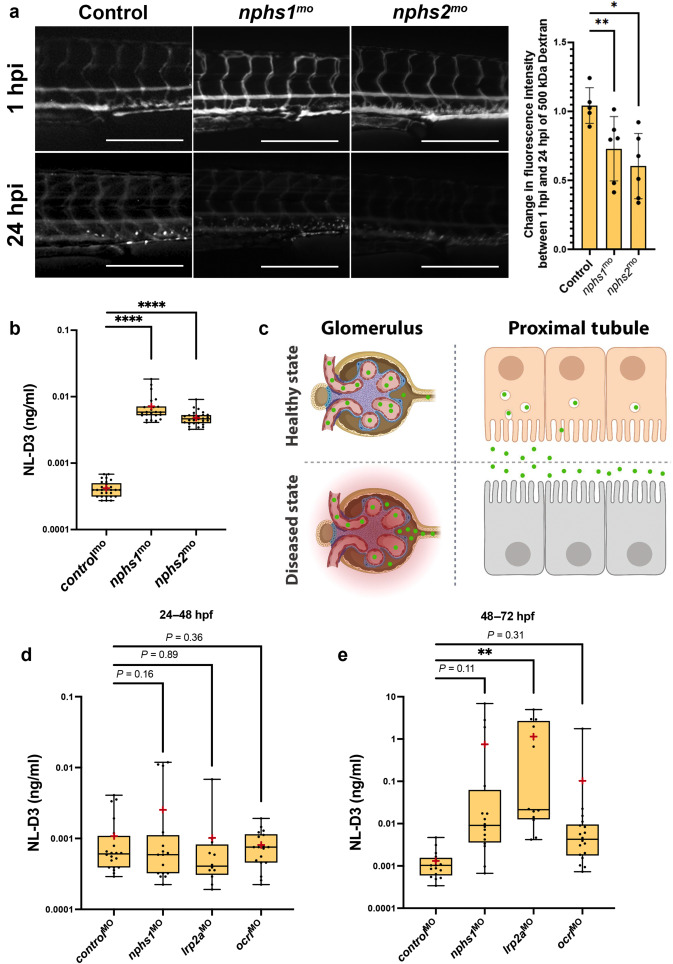
Figure 3. NL-D3 zebrafish can also be used to study glomerulopathies. (a) The panels show 4-day post-fertilization embryos injected with a 500 kDa fluorescein isothiocyanate–conjugated dextran at 1 hour post injection (hpi) and 24 hpi after the treatments shown (controlmo, n = 5; nphs1mo, n = 6; and nphs2mo, n = 6). Bar = 250 μm. The bar chart to the right shows the change in fluorescence intensity measured in the dextran-injected embryos at 24 hpi compared with 1 hpi. (b) Box and whisker plot showing the amount of NL-D3 detected in the embryo medium in control (n = 29), nphs1 (n = 28), and nphs2 (n = 22) morphant embryos. (c) Schematic highlighting the barrier function of the healthy state glomerular filter to NL-D3 and its reuptake in healthy state proximal tubules (top panels). The lowered barrier function in the glomerulus and the reduced endocytosis activity in the proximal tubules are displayed in the bottom panels, to schematically represent the dysfunction in these 2 tissues in a diseased state. (d,e) Box and whisker plots showing NL-D3 detected in the embryo medium taken from embryos treated as shown between 24–48 hours post fertilization (hpf) (d) and 48–72 hpf (e) (controlmo, n = 20; nphs1mo, n = 16; lrp2amo, n = 6; and ocrlmo, n = 18). In (b), (d), and (e), median is shown as a line and mean is shown as a red cross-hair. ∗P ≤ 0.05; ∗∗P ≤ 0.01; ∗∗∗∗P ≤ 0.001.