
Image
|
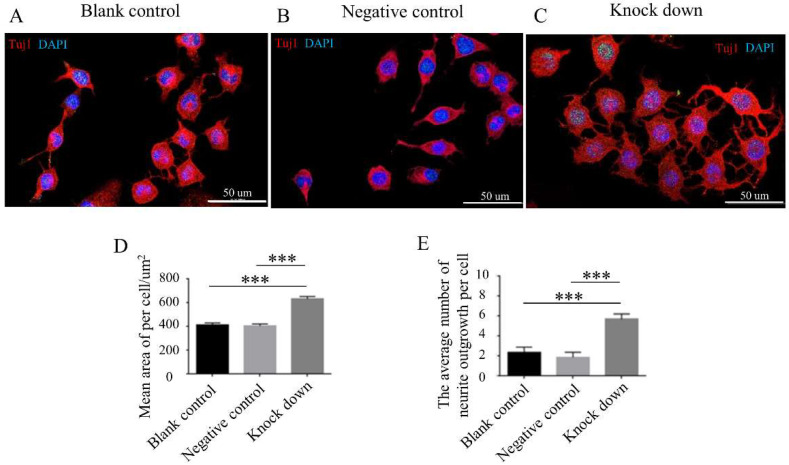
Figure Caption
Fig. 4
Comparison of neuron polarity among different N-2a cell groups. (A–C) Double immunofluorescent labeling (Tuj1) of N-2a cell lines. (D,E) Comparison of mean area of per cell/um2 and amount of neurite outgrowth per cell in different groups. ***, p < 0.001, one-way ANOVA with Bonferroni post hoc, n = 3. Knockdown, infected with Doc2a-lentivirus; negative control, Lentivirus Luciferase Reporter negative control; blank control, cultured with an equal medium.
Acknowledgments
This image is the copyrighted work of the attributed author or publisher, and
ZFIN has permission only to display this image to its users.
Additional permissions should be obtained from the applicable author or publisher of the image.
Full text @ Int. J. Mol. Sci.