
Image
|
Figure Caption
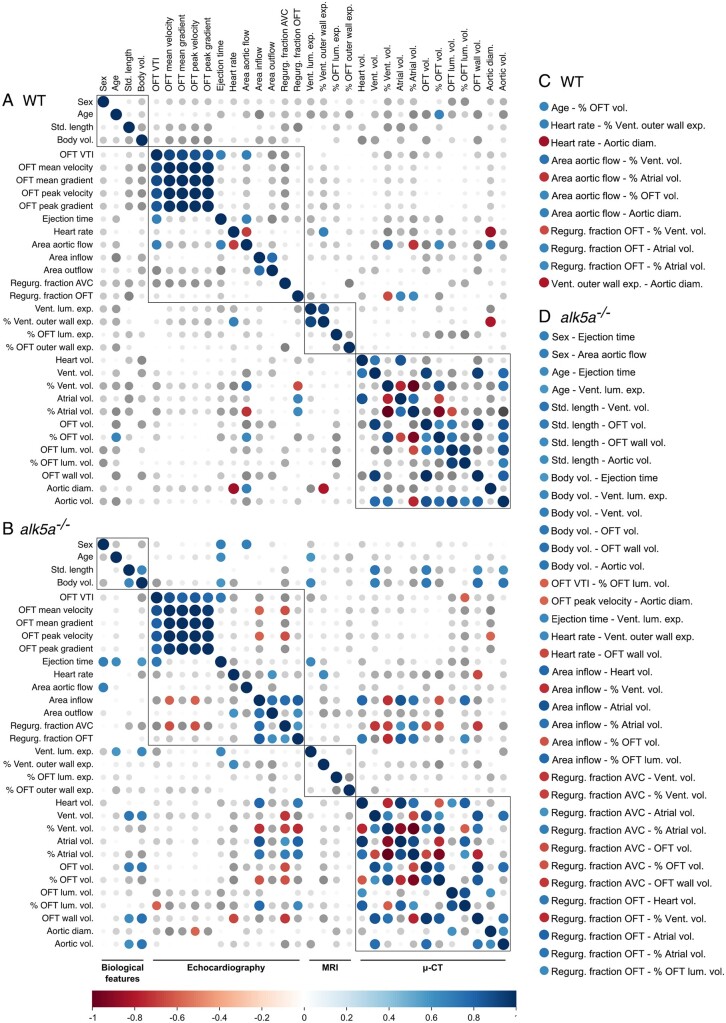
Fig. 5
Correlation analysis of all the measured parameters reveals previously undetected cardiovascular phenotypes. (A, B) Correlograms of all the parameters analysed including biological features, as well as echocardiography, MRI and μ-CT analyses across all the WT (A; n = 10) and alk5a–/– (B; n = 12) zebrafish. Positive and negative correlations are shown in blue and red, respectively; dot size represents Pearson’s correlation coefficient. (C, D) Significant correlations (P < 0.05) in WT (C) and alk5a–/– (D) zebrafish.
Acknowledgments
This image is the copyrighted work of the attributed author or publisher, and
ZFIN has permission only to display this image to its users.
Additional permissions should be obtained from the applicable author or publisher of the image.
Full text @ Cardiovasc. Res.