
Image
|
Figure Caption
Fig. 2
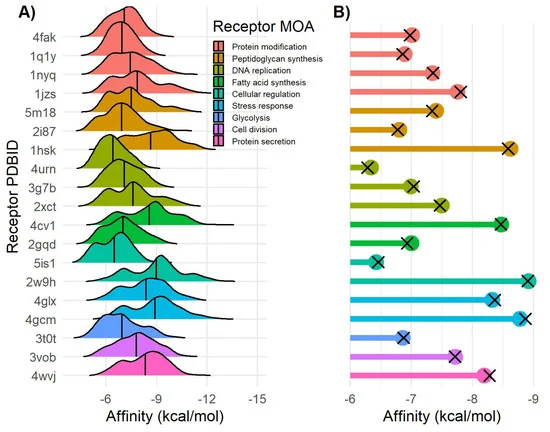
Figure 2. Docking affinity of Verongiida NPs data set. (A) Density distribution of affinity values for each MRSA target. (B) Lollipop plot representing mean value of Pseudoceratina NPs subset (colored dots) and Verongiida subset displaying activity against Staphylococcus pathogens in ChEMBL (black cross).
Acknowledgments
This image is the copyrighted work of the attributed author or publisher, and
ZFIN has permission only to display this image to its users.
Additional permissions should be obtained from the applicable author or publisher of the image.
Full text @ Mar. Drugs