
|
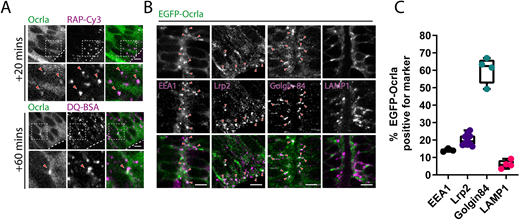
Fig. 4
Ocrl localises to early endocytic compartments in neuroepithelial cells. (A) Representative confocal images of live 28 hpf zebrafish embryos transiently expressing EGFP–Ocrla after hindbrain ventricle injection of RAP–Cy3 or DQ-BSA. Regions within the dashed boxes are magnified in the lower panels. Arrowheads point to co-localisation between Ocrla signal and RAP–Cy3 or DQ-BSA. Scale bars: 5 µm. (B) Representative images of fixed tissue sections through the hindbrain of embryos transiently expressing EGFP–Ocrla and stained with antibodies against EEA1, Lrp2, Golgin-84 or LAMP1. Arrowheads indicate instances of co-localisation between Ocrla and the indicated marker. Scale bars: 5 µm. (C) Quantification of co-localisation between Ocrla puncta and EEA1 (n=3), Lrp2 (n=10), Golgin-84 (n=4) or LAMP1 (n=4) on fixed tissue sections. Each data point represents one individual embryo. Error bars represent the s.d.