
|
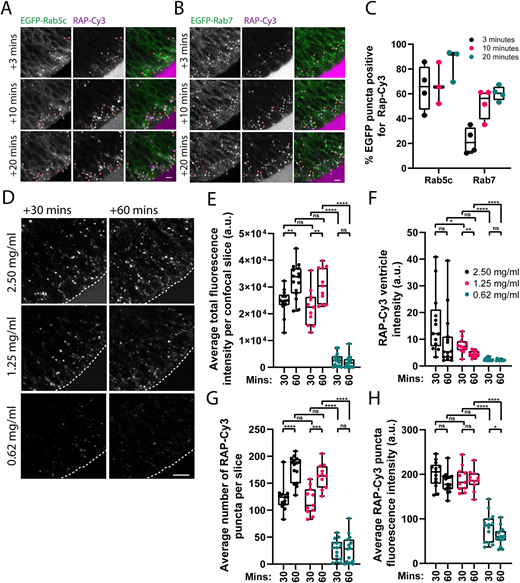
Fig. 2
Characterisation of neuroepithelial RAP endocytosis and endocytic trafficking. (A,B) Confocal microscopy images of RAP–Cy3 co-localisation with stably expressed EGFP–Rab5c (A) or EGFP–Rab7 (B) in live zebrafish embryos at 3, 10 and 20 min post injection of 2.5 ng of RAP–Cy3 into the hindbrain ventricle. Arowheads indicate co-localisation between RAP–Cy3 and EGFP–Rab5c or EGFP–Rab7. Scale bars: 5 µm. (C) Quantification of co-localisation of RAP–Cy3 and EGFP–Rab5c (n=3), and RAP–Cy3 and EGFP–Rab7 (n=4) at the indicated timepoints. Each datapoint represents one individual embryo. Error bars show the s.d. (D) Representative confocal microscopy images from live imaging of RAP–Cy3 accumulation in neuroepithelial cells at 30 and 60 min post injection of 2.5, 1.25 or 0.625 mg/ml RAP–Cy3. Scale bar: 10 µm. (E–H) Quantification of the average total fluorescence intensity per confocal slice (E), RAP–Cy3 ventricle intensity at 30 or 60 min (F), the average number of RAP–Cy3 puncta per confocal slice (G) and the average segmented RAP–Cy3 punctum fluorescence intensity (H) post hindbrain injection of the indicated concentrations of RAP–Cy3 (2.5 mg/ml, n=15; 1.25 mg/ml, n=11; 0.625 mg/ml, n=15). a.u. arbitrary units. ns, not significant; *P<0.05; **P<0.01; ***P<0.001; ****P<0.0001. Statistical comparisons between groups were made using two-tailed unpaired Student's t-test.