Fig. 4
Image
Figure Caption
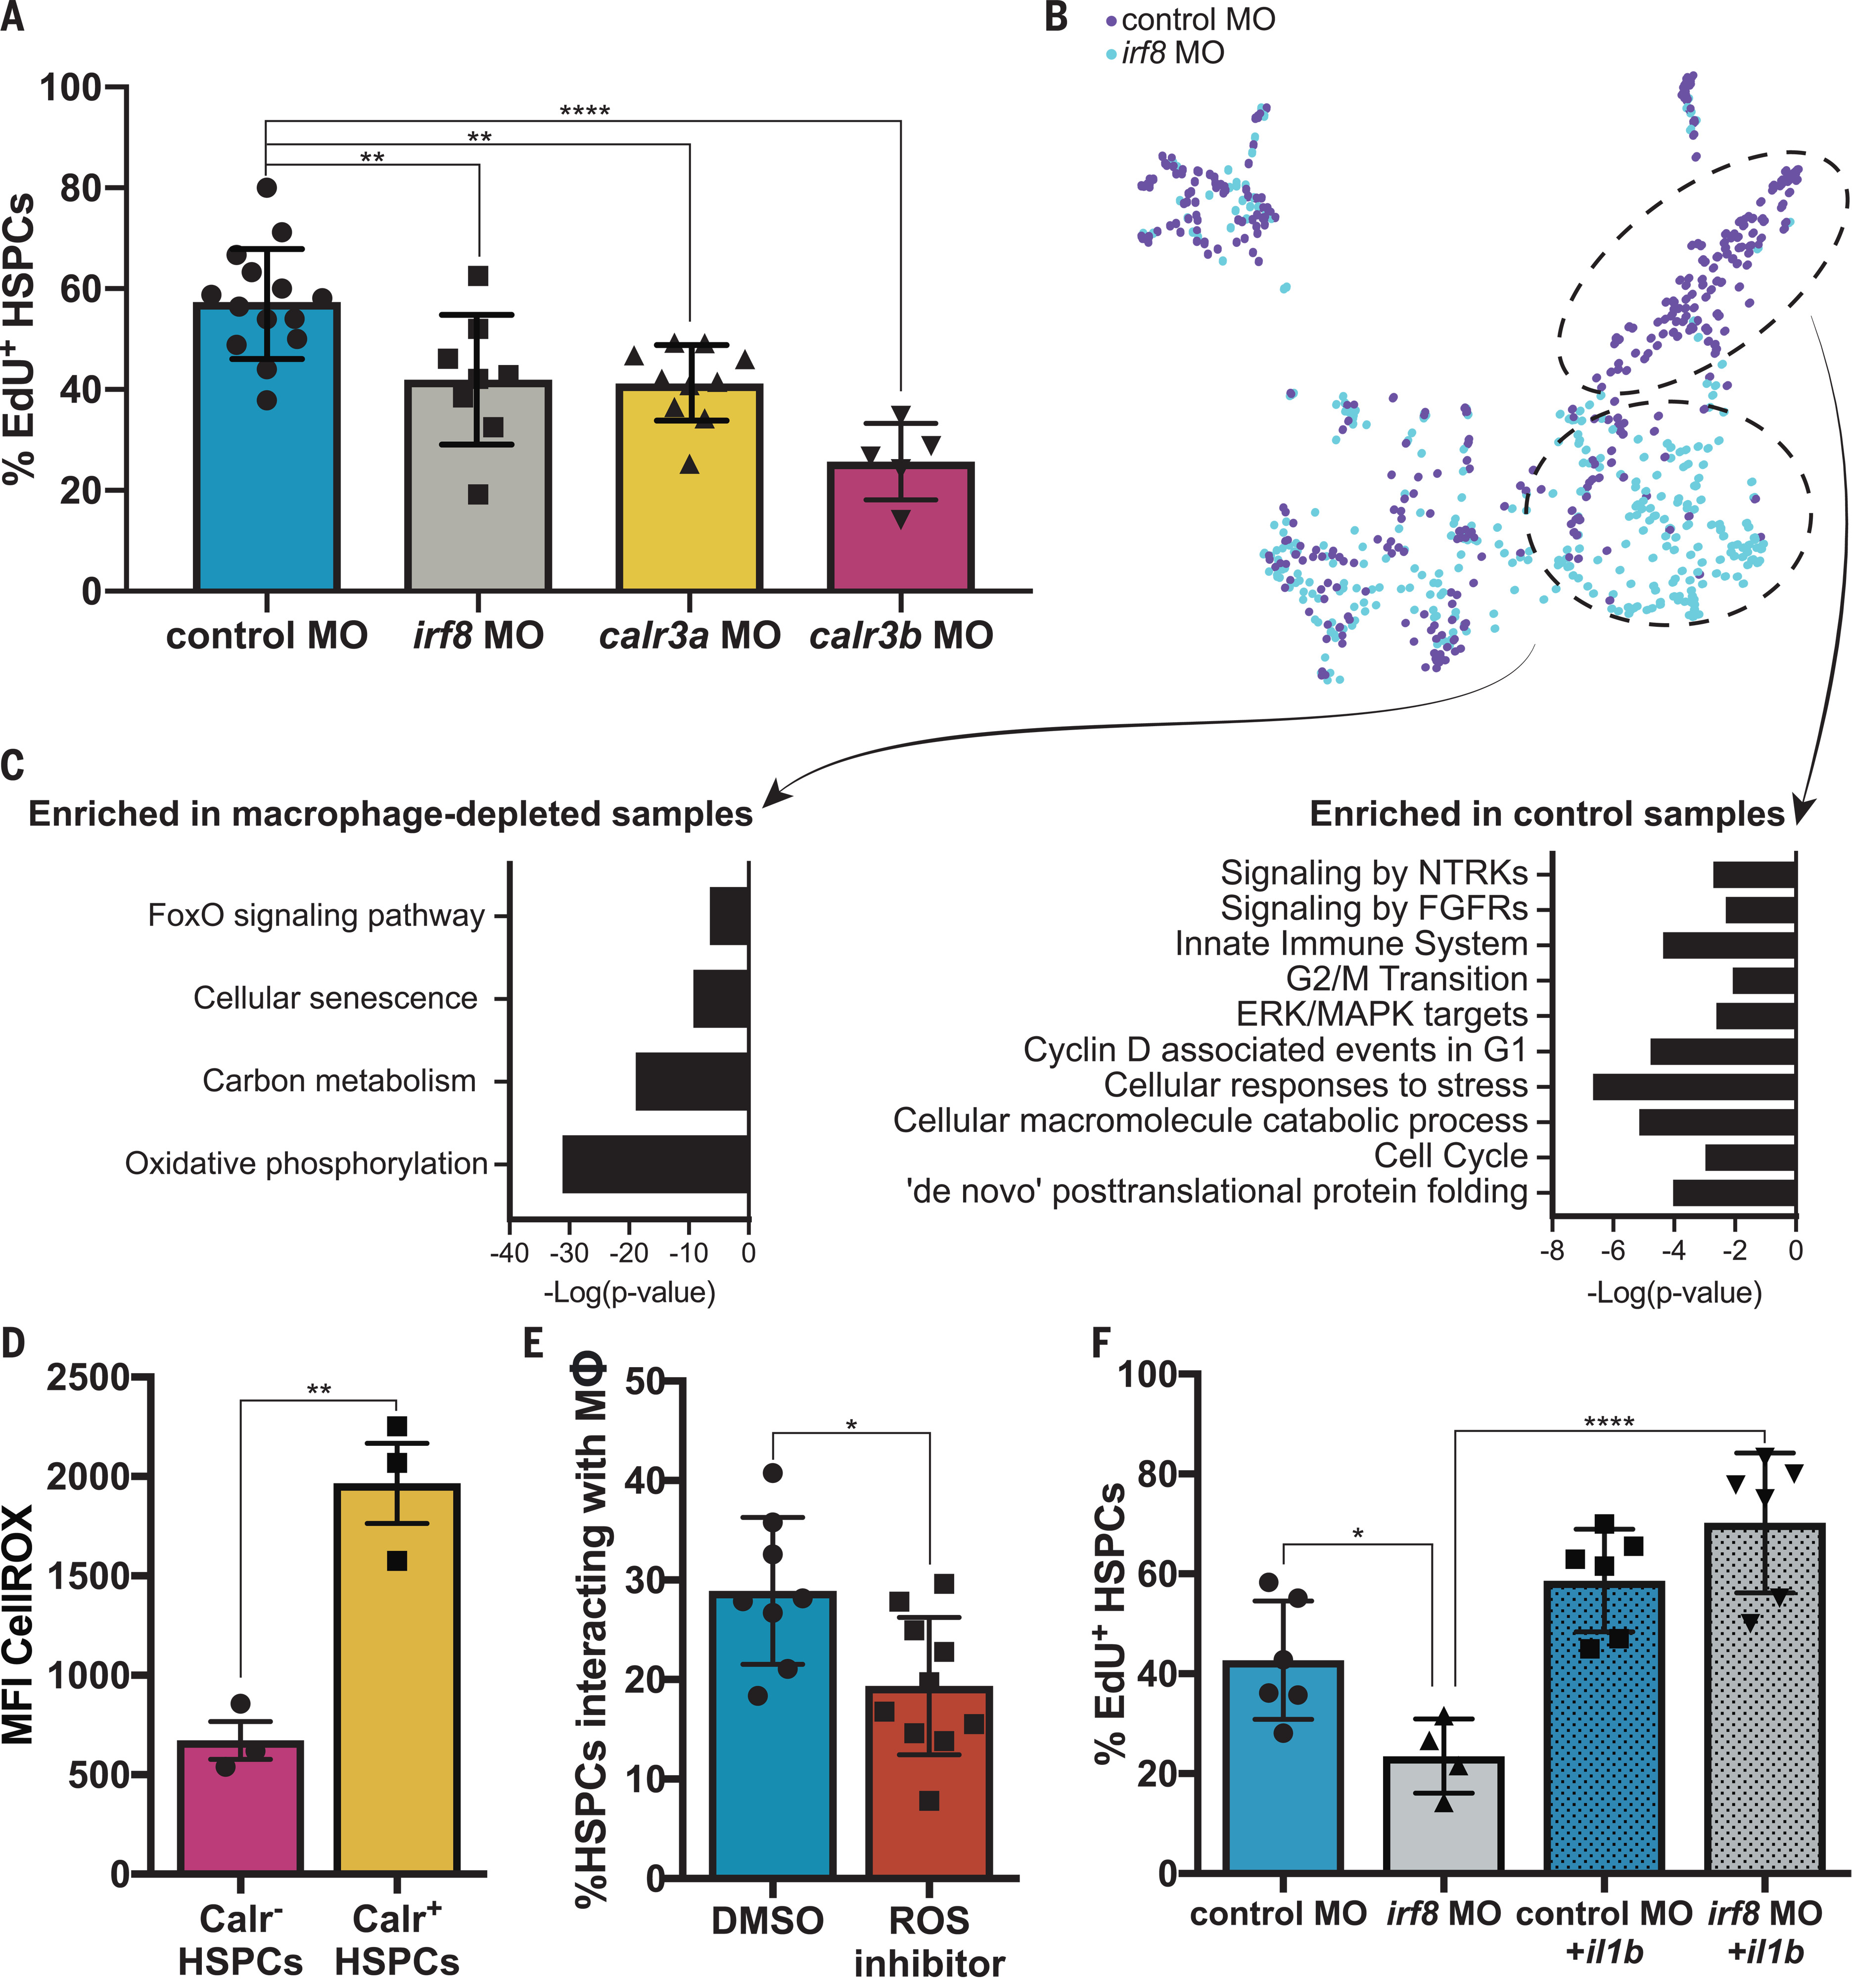
Fig. 4. Macrophages buffer HSPC stress and regulate HSPC expansion.
(A) EdU staining of runx1+23:mCherry embryos injected with either the calr3a, calr3b, or irf8 morpholinos identifies a significant reduction in proliferating HSPCs at 3 dpf. Data are means ± SD. Data were analyzed by one-way ANOVA with Dunnett’s multiple comparisons test; **P < 0.01 and ****P < 0.0001. (B and C) scRNA-seq analysis of runx1+23+ FACS-purified cells from irf8 or control morphants reveals a population of stressed HSPCs that persist in the absence of macrophages and a population of cycling cells enriched in the control sample. (D) Embryonic HSPCs marked by surface Calreticulin exhibit higher levels of ROS. Data are means ± SD. Data were analyzed by unpaired Student’s t test; **P < 0.01. MFI, median fluorescence intensity. (E) ROS inhibition with diphenylene iodonium significantly reduces macrophage-HSPC interactions. Data are means ± SD. Data were analyzed by unpaired Student’s t test; *P < 0.05. DMSO, dimethyl sulfoxide. (F) Expression of il1b by heat shock rescues the effect of macrophage depletion on HSPC proliferation. Data are means ± SD. Data were analyzed by one-way ANOVA with Sidak’s multiple comparisons test; *P < 0.05 and ****P < 0.001.
Acknowledgments
This image is the copyrighted work of the attributed author or publisher, and
ZFIN has permission only to display this image to its users.
Additional permissions should be obtained from the applicable author or publisher of the image.
Full text @ Science

