
Image
|
Figure Caption
Fig. 9
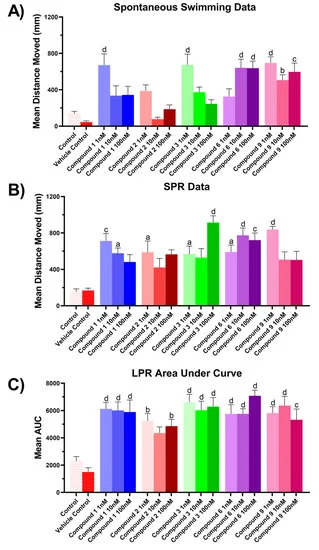
Figure 9. Zebrafish assay results for compounds 1–3, 6 and 9. (A) Spontaneous, unstimulated swimming bioassay, (B) SPR bioassay, (C) LPR bioassay. All results for (A) and (B) are shown as mean ± SEM, n = 9. Results for (C) are shown as mean of the area under the curve ± SEM, n = 9. Significant difference between treatment and vehicle control indicated by letter a, b, c or d. (one-way ANOVA, Tukeys test, a: p < 0.05, b: p < 0.01, c: p < 0.001, d: p < 0.0001). Where no significant difference was observed between treatment and vehicle control no letter was included.
Acknowledgments
This image is the copyrighted work of the attributed author or publisher, and
ZFIN has permission only to display this image to its users.
Additional permissions should be obtained from the applicable author or publisher of the image.
Full text @ Mar. Drugs