
|
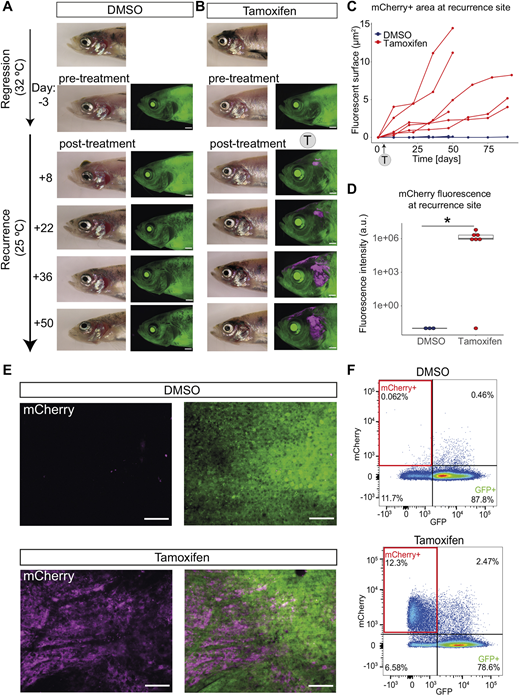
Fig. 6
Persister cells directly contribute to melanoma recurrent disease. (A) Representative images of control fish with no mCherry fluorescence. A fish with a regressed melanoma (top image, primary tumour; below, regressed tumour) treated with vehicle (0.04-0.05% DMSO at 32°C) showing no green-to-red fluorophore switch in the melanoma MRD compared to the pre-treatment image. Follow-up brightfield and fluorescent acquisitions (every 14 days) show progression of tumour recurrence over time with no appearance or increase in mCherry fluorescence. Scale bars: 1 mm, N=5 fish (sum of two independent experiments). (B) mCherry+ persister cells from MRD are present through to recurrence. A fish with a regressed melanoma (top image, primary tumour; below, regressed tumour) treated with 4-5 µM tamoxifen (at 32°C) showing green-to-red fluorophore switch (in magenta) in the melanoma MRD. Follow-up brightfield and fluorescent acquisitions (every 14 days) show progression of tumour recurrence over time with increasing mCherry signal. Scale bars: 1 mm, N=7 fish (sum of two independent experiments). (C) mCherry+ persister cells increase over time. Line plot of area quantification of mCherry signal using fluorescent acquisitions over time during melanoma recurrence. DMSO (blue), N=5 fish; tamoxifen-treated group (red), N=6 fish (sum of two independent experiments for both groups). Trajectories of melanoma growth represent individual fish. (D) Box plot of fluorescence intensity quantification of mCherry signal of recurrent disease that has grown from MRD treated with tamoxifen. Intensity was measured using average intensity projections of confocal images of recurrence sites comparing DMSO to tamoxifen condition. Lines in boxes indicate the medians, hinges correspond to 25th and 75th percentiles, and whiskers indicate data within 1.5 interquartile range of the upper and lower quartiles. Dots beyond end of whiskers represent outliers. DMSO, N=3 fish; tamoxifen-treated group, N=4 fish with seven recurred melanomas; *P<0.05, Wilcoxon test. Outlier sample in tamoxifen treatment group is likely to be false negative as mCherry fluorescence was later confirmed using flow cytometry in this highly pigmented sample. a.u., arbitrary units. (E) mCherry is present only in recurrent disease that has grown from MRD treated with tamoxifen. STD projections of z-stack confocal acquisition show recurred melanoma sites of fish treated with vehicle (DMSO, top row) or tamoxifen (bottom row) at the MRD stage. Scale bars: 100 µm. (F) mCherry+ cells in recurrent disease are detectable by fluorescence-activated cell sorting. A representative pseudocolour flow cytometry plot of a recurred melanoma lesion from DMSO-treated fish and tamoxifen-treated fish. mCherry+ cells highlighted in red rectangles (12.3% versus 0.062%). DMSO, N= 4 fish; tamoxifen, N=5 fish (sum of two independent experiments).