
|
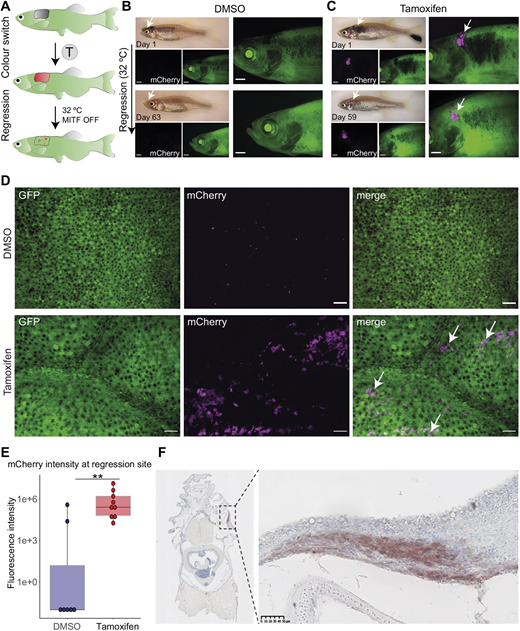
Fig. 4
Persister cells originate from the primary tumour. (A) The experimental workflow of tamoxifen (T) treatment and melanoma regression at the higher water temperature (32°C, MITF OFF). At the higher temperature, mitfa RNA is still expressed but is not spliced correctly and therefore MITF activity is abolished. Loss of MITF activity leads to tumour regression with remaining persister cells at the minimal residual disease (MRD) site. (B) A fish treated with vehicle (0.05% DMSO) showing no green-to-red recombination in the primary tumour (top) or after regression (bottom). Scale bars: 1 mm, white arrows point at the tumour site, N=4 fish. (C) A fish treated with tamoxifen (5 µM) showing expression of mCherry+ cells in a primary tumour (magenta, white arrows) that are still detected 59 days after initiation of melanoma regression (bottom, white arrows). Scale bars: 1 mm, N=7 fish. (D) STD projections of confocal z-stack acquisitions of regression sites of fish treated with DMSO or tamoxifen. White arrows point to mCherry+ cells (magenta) only present in the tamoxifen-treated condition. Scale bars: 50 μm; DMSO, N=4 fish; tamoxifen, N=7 fish. (E) Box plot of fluorescence intensity quantification of mCherry signal using average intensity projections of confocal images of residual disease. Lines in boxes indicate the medians, hinges correspond to 25th and 75th percentiles, and whiskers indicate data within 1.5 interquartile range of the upper and lower quartiles. DMSO, N=4 fish with seven regression sites; tamoxifen, N=7 fish with nine regression sites; **P<0.01, Wilcoxon test. (F) Immunohistochemistry of the MRD site. FFPE transverse section stained with anti-mCherry antibody reveals ‘switched’ cells at the MRD site. Right panel shows an enlarged view of MRD, outlined by the black dashed line rectangle (left panel). Signal in red (AEC substrate) counterstained with nuclear marker Haematoxylin (blue). Scale bar: 50 µm, N=3 fish.