IMAGE

FIGURE 4

ID
ZDB-IMAGE-220914-7
Source
Figures for Coffin et al., 2022
Image
Figure Caption

FIGURE 4

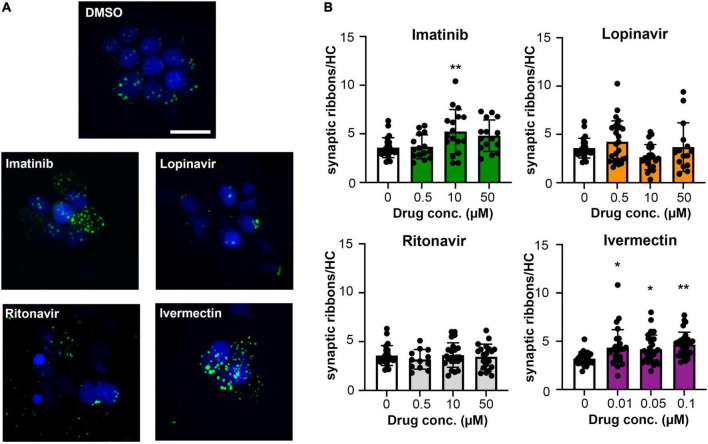
Some COVID-19 drugs alter the number of pre-synaptic ribbons. Rib-GFP fish were live-labeled with DAPI and treated with imatinib, lopinavir, ritonavir, or ivermectin for 24 h. (A) Representative confocal images of DMSO (vehicle) controls and the highest concentration of each COVID-19 drug (50 μM imatinib, lopinavir, and ritonavir; 0.1 μM ivermectin). Hair cell nuclei are labeled in blue, green punctae represent GFP + ribbons. The scale bar in the top image = 10 μm and applies to all panels. (B) Quantified GFP + punctae per remaining hair cell. Data were analyzed by one-way ANOVA followed by Bonferroni-corrected post hoc tests. One-way ANOVA results and sample sizes are as follows: Imatinib F(3,66) = 4.916, p = 0.0038 (N = 5–6 fish, 15–17 neuromasts per group). Lopinavir: F(3,83) = 3.140, p = 0.0296 (N = 7–10 fish, 15–30 neuromasts per group). Ritonavir: F(3,75) = 0.4199, p = 0.7392 (N = 4–7 fish, 12–24 neuromasts per group). Ivermectin: F(3,101) = 4.929, p = 0.0031 (N = 9 fish, 27 neuromasts per group). Asterisks indicate significance differences from vehicle (DMSO) controls. *p < 0.05, **p < 0.01. Note that the imatinib, lopinavir, and ritonavir experiments were run concurrently and therefore shared control animals. Control values for that experiment are not significantly different from control values from the ivermectin experiment (t-test, p = 0.15). Data are represented as mean ± 1 s.d. and black dots represent individual neuromasts.

Acknowledgments
This image is the copyrighted work of the attributed author or publisher, and ZFIN has permission only to display this image to its users. Additional permissions should be obtained from the applicable author or publisher of the image. Full text @ Front. Cell. Neurosci.