
Image
|
Figure Caption
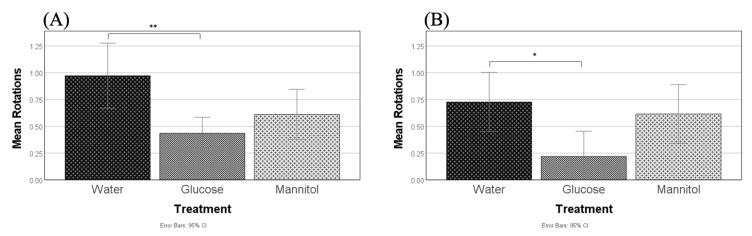
Fig. 10
Optomotor responses. Optomotor responses (OMRs) were measured after (A) 8 weeks and (B) 12 weeks of hyperglycemia. At both timepoints, one-way ANOVA identified reduced positive OMRs in glucose-treated fish compared to water-treated controls (8-weeks, p = 0.002, **; 12-weeks, p = 0.033, *). Values presented are means +/−95% CI.
Acknowledgments
This image is the copyrighted work of the attributed author or publisher, and
ZFIN has permission only to display this image to its users.
Additional permissions should be obtained from the applicable author or publisher of the image.
Full text @ Int. J. Mol. Sci.