
|
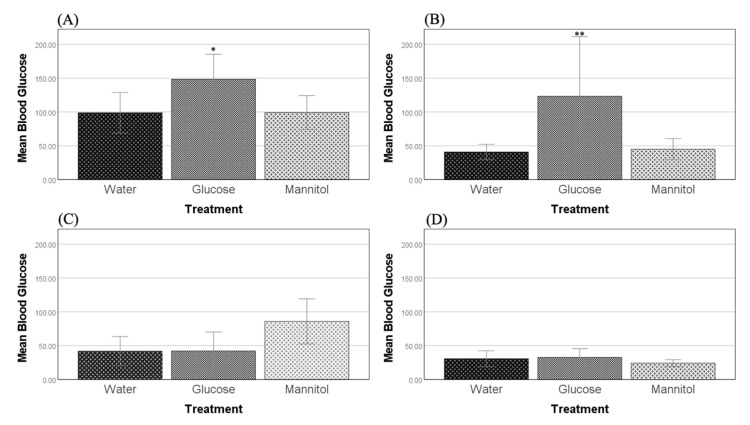
Fig. 1
Blood glucose levels. Blood glucose levels were measured after (A) 8 weeks and (B) 12 weeks of hyperglycemia. At both timepoints, glucose-treated fish had significantly higher blood sugar levels than either water- or mannitol-treated controls (one-way ANOVA, 8 weeks, p = 0.037, p = 0.048, * respectively; 12 weeks, p = 0.010, p = 0.011, ** respectively). Values are means +/−95% CI. n = 23 (8 weeks); n = 32 (12 weeks). Four weeks of recovery after either four weeks of hyperglycemia (C) or eight weeks of hyperglycemia (D) showed that glucose-treated fish were no longer significantly different from either of the controls. Values are means +/−95% CI. n = 18 (8-week washout); n = 30 (12-week washout).