IMAGE

Fig 5

ID
ZDB-IMAGE-220904-26
Source
Figures for Wang et al., 2022
Image
Figure Caption

Fig 5 Elevated micronuclei during embryogenesis does not contribute to enhanced tumor onset.

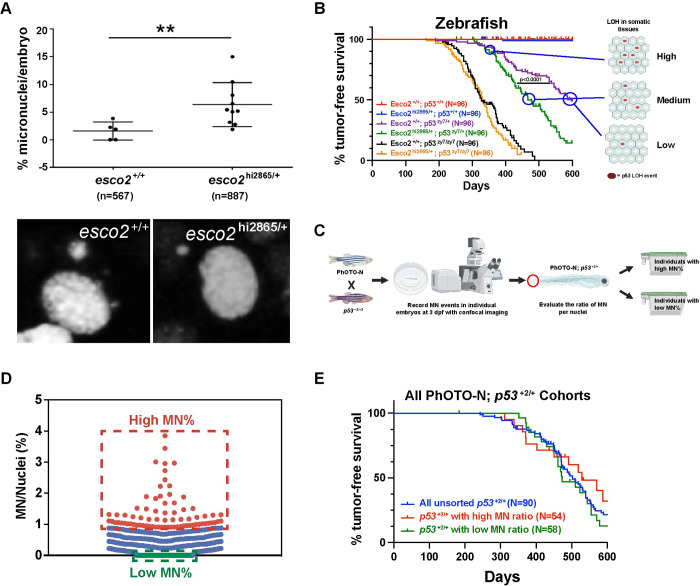
(A) Micronuclei (MN) during interphase were counted in six esco2+/+ and ten esco22865/+ H2A.F/Z-EGFP mRNA injected embryos at 24hpf using two-hour live imaging time-lapse data from each embryo. Each dot represents an embryo measured. Percentage MN/embryo was calculated based on the total number of micronuclei per total nuclei present in the time lapse at t = 0. Total nuclei are indicated in parenthesis. Mean ± SD, ** p-value < 0.01 based on unpaired t-test. Representative black and white images of micronuclei in each genotype are shown below. (B) Proposed model where the proportion of cells with MN would correlate with p53 LOH and timing of tumor formation. (C) Experimental workflow to establish high and low MN cohorts, using confocal living-imaging of 3-dpf p53+2/+; TGPhOTO-N/+ embryos. Figure B and C were created with BioRender.com. (D) Dot-blot of Micronuclei frequency in individual 3-dpf p53+2/+; TGPhOTO-N/+ embryos. Individuals deemed part of the high MN cohort were highlighted with red (MN%>0.9%) and individuals in the low MN cohort were highlighted with green (MN% = 0). (E) Zebrafish Kaplan-Meier curves for tumor-free survival for p53+2/+; TGPhOTO-N/+ unsorted (n = 90), p53+2/+; TGPhOTO-N/+ with high NM ratio(n = 54) and p53+2/+; TGPhOTO-N/+ with high NM ratio (n = 58). P-value is not significance when comparing each other based on Log-rank (Mantel-Cox) test.

Acknowledgments
This image is the copyrighted work of the attributed author or publisher, and ZFIN has permission only to display this image to its users. Additional permissions should be obtained from the applicable author or publisher of the image. Full text @ PLoS Genet.