IMAGE

FIGURE 5

ID
ZDB-IMAGE-220826-6
Source
Figures for Hu et al., 2022
Image
Figure Caption

FIGURE 5

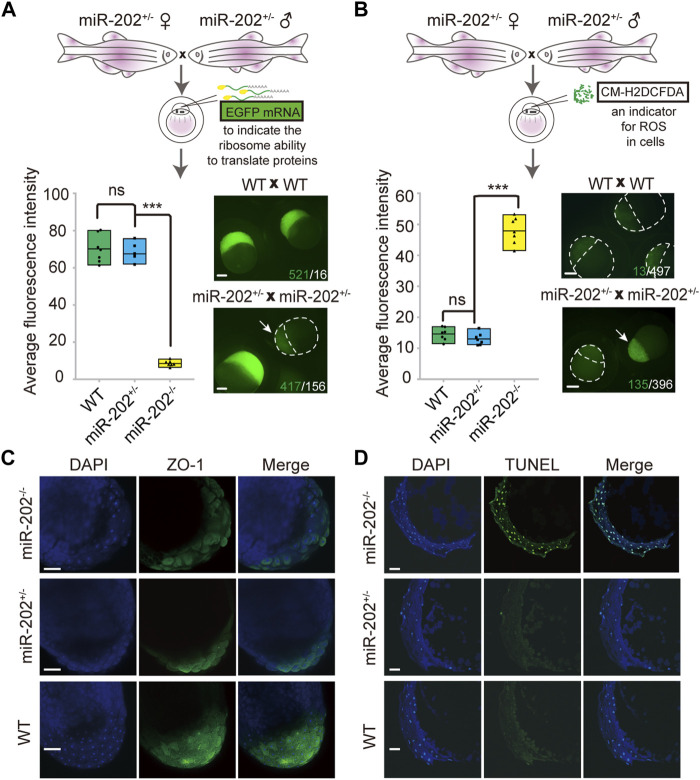
Homeostatic disorders in miR-202−/− embryos. (A) Illustrations showing assessment of translation efficiency using polyadenylated EGFP mRNA. Embryos derived from miR-202 heterozygous parents were used for assessment. Drastically reduced fluorescence intensity (bottom left panel) and images (bottom right panel) were obtained from the miR-202−/− embryos at 3.5 hpf. The embryo pointed to by white arrows was a miR-202−/− embryo, as verified through genotyping. The scale bar is 200 µm. The green number indicates the number of embryos successfully expressing EGFP, and in white the number indicates the number of embryos that unexpressed or low expressed EGFP. (B) Illustrations showing assessment of reactive oxygen species using CM-H2DCFDA. Embryos derived from miR-202 heterozygous parents were used for assessment. Elevated fluorescence intensity (bottom left panel) and images (bottom right panel) were obtained in the miR-202−/− embryos at 3.5 hpf. The embryo indicated by the white arrow was a miR-202−/− embryo, as verified through genotyping. The green number indicates the number of embryos that produce high level of ROS, and in white the number indicates the number of embryos with low ROS levels. The scale bar is 200 µm. (C) Immunohistochemical detection of zonula occludens-1 (ZO-1) in wild type and miR-202 mutant embryos at 3.5 hpf. The scale bar is 100 µm. (D) TUNEL staining for apoptotic signals in the wild type and miR-202 mutant embryos at 3.5 hpf. The scale bar is 100 µm. Error bars, mean ± s.d., n = 3 (biological replicates).

Acknowledgments
This image is the copyrighted work of the attributed author or publisher, and ZFIN has permission only to display this image to its users. Additional permissions should be obtained from the applicable author or publisher of the image. Full text @ Front Cell Dev Biol