
|
Fig. 3
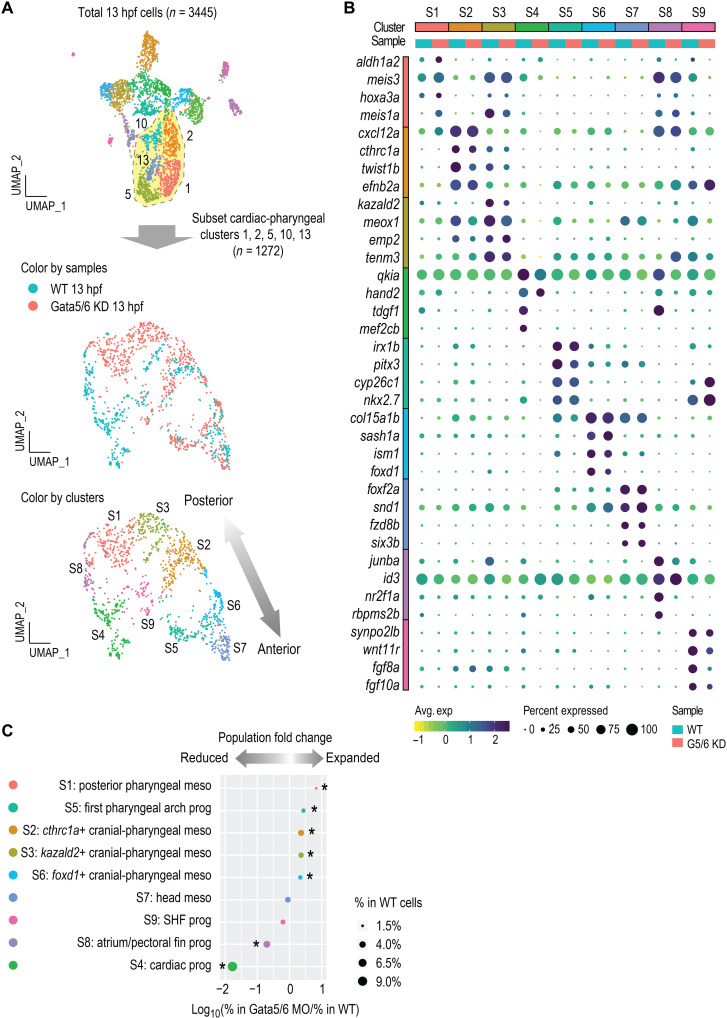
(A) Subclustering analysis of the cardiac and pharyngeal mesoderm lineages. Clusters 1, 2, 5, 13, and 14 were subset from the combined 13 hpf dataset shown in Fig. 2 and reanalyzed. New clustering results are visualized by UMAPs that are colored by samples (top) and by cluster IDs (bottom). (B) Dot plot showing the mean expression levels (color) of marker genes and the percentages of cells in which marker genes are expressed (size) in each cluster, with WT and Gata5/6 KD cells plotted separately. (C) Cell composition changes of each cluster (after subclustering) between Gata5/6 KD and WT samples. Asterisks indicate significant differences (Fisher’s exact test, Bonferroni correction, adjusted P < 0.05). Dot sizes show the percentage of each cluster within the whole WT population (total 13 hpf WT cells).