
Image
|
Figure Caption
Fig. 1
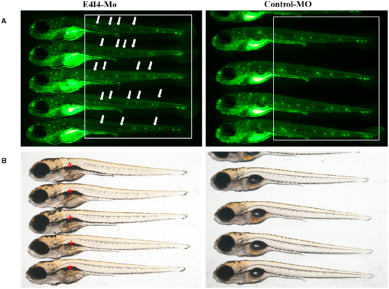
Fig. 1. Fluorescence imaging on E4I4–Mo and control-Mo zebrafish at 7dpf. (A) Fluorescence field: the lateral line of zebrafish is shown in the white box; the white arrows point to the diminished fluorescent signals of neuromasts. (B) Bright field: the red stars mark the uninflated swim bladders. . (For interpretation of the references to color in this figure legend, the reader is referred to the Web version of this article.)
Figure Data
Acknowledgments
This image is the copyrighted work of the attributed author or publisher, and
ZFIN has permission only to display this image to its users.
Additional permissions should be obtained from the applicable author or publisher of the image.
Reprinted from Gene expression patterns : GEP, 43, Wang, W.Q., Qiu, S.W., Huang, S.S., Wang, G.J., Han, M.Y., Kang, D.Y., Yuan, Y.Y., Gao, X., Dai, P., Transcriptome analysis of the early stage ifnlr1-mutant zebrafish indicates the immune response to auditory dysfunction, 119229, Copyright (2021) with permission from Elsevier. Full text @ Gene Expr. Patterns