
|
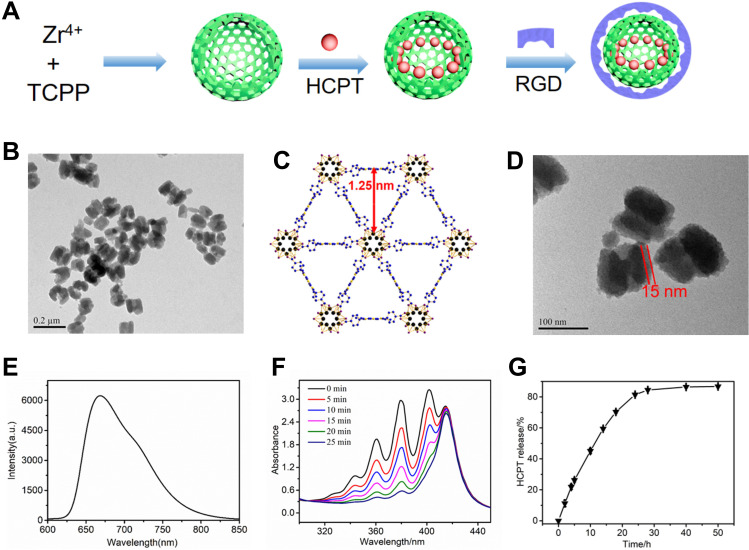
Fig. 1
Synthesis and characterization of HCPT@NMOFs-RGD. (A) Scheme for the synthesis of HCPT@NMOFs-RGD nanocomposites. (B) TEM image of NMOFs. (C) View of NMOFs with uniform triangular 1D channels observed in the structure. (D) TEM images of NMOFs-RGD. Note that the RGD layer is distributed around the NMOFs at a thickness of 15 nm. (E) Fluorescence spectra (excitation at 530 nm) of NMOFs-RGD aqueous solution. (F) Absorbance spectra of ABDA in the presence of NMOFs-RGD over different periods under laser irradiation at 655 nm. (G) HCPT release performance of HCPT@NMOFs-RGD nanocomposites in PBS. Scale bar in (B): 0.2 μm; (D): 100 nm.