
Image
|
Figure Caption
Fig. 4
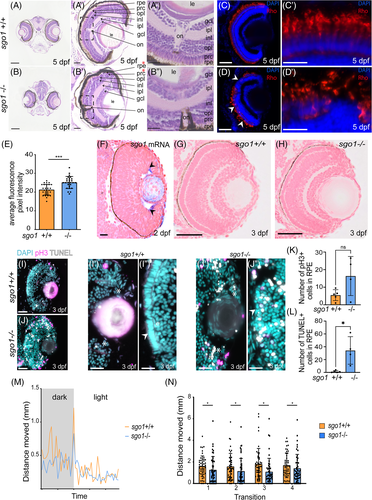
sgo1−/− larvae display morphological defects in the eye, accompanied with slow motility and reduced sensitivity to light/dark cycle. (A, B) Images of wild type and mutants H&E transverse sections of the zebrafish at 5 dpf showing the layers and components of the eye, zoom in of both eyes are shown. rpe: retinal pigmented epithelium, prc: photoreceptor cell layer, opl: outer plexiform layer, inl: inner nuclear layer, ipl: inner plexiform layer, gcl: ganglion cell layer, on: optic nerve and le: lens. Red stars denote the Retinal pigmented epithelia and photoreceptor layer that has been disrupted in the mutants (sgo1+/+ n = 6, sgo1−/− n = 6). (C,D) Rhodopsin labeling in retinal cryosections of 5 dpf sgo1+/+ and sgo1−/− larvae. (C′,D′) Higher magnifications of retinal regions labeled with Rhodopsin labeling in sgo1+/+ and sgo1−/− larvae. (E) Quantification of Rhodopsin localization to the photoreceptor cell bodies of 5 dpf sgo1+/+ and sgo1−/− larvae (sgo1+/+ n = 24, sgo1−/− n = 24). (F) Transverse section of sgo1 in situ hybridization on sgo1+/+ embryo (2 dpf; n = 6). Black arrows showing the expression in the ciliary marginal zone (cmz). (G,H) Transverse section of sgo1+/+ and sgo1−/− embryos at 3 dpf. (I,J) Combined mitotic marker (pH3) and TUNEL assay for cell death is shown for 3 dpf sgo1+/+ and sgo1−/− larvae (sgo1+/+ n = 5, sgo1−/− n = 4). (I′,J") Zoom-in images of retinal regions in sgo1+/+ and sgo1−/− larvae, stem cell niche area is shown with asterisks. (K,L) Quantification of pH 3+ and TUNEL+ cells in RPE of 3 dpf sgo1+/+ and sgo1−/− larvae (sgo1+/+ n = 5 and sgo1−/− n = 4). (M,N) Visual function recorded by visual motor behavioral assay showing the distance moved by the larvae in both groups during light ON transitions. (M) Average one light ON response recorded in 5 dpf sgo1−/− and sgo1+/+ larva (sgo1+/+ n = 48, sgo1−/− n = 48). The grey region represents the period in darkness; the white region represents the period in light. (N) The total distance moved by larvae of both groups during the first second after four consecutive light ON transitions. Functional measurements were performed in two biological replicates. Each data point represents a single larva (sgo1+/+ n = 48, sgo1−/− n = 48). Scale bar is at 200 μm for tile scan images taken at a magnification of 20×, and 25 μm for zoom-in of eye at a magnification of 40× (for A–D). Photoreceptor cell images in C′,D′ were taken at a magnification of 63× with a scale bar of 25 μm. Retinal image in F was taken at a magnification of 63x with a scale bar of 10 μm. Retinal image in G and H were taken at a magnification of 40× with a scale bar of 20 μm. Retinal images in I and J were taken at a magnification of 40× with a scale bar of 50 μm. Retinal images in I′,I″, J', and J" were taken at a magnification of 40× with a with a 200% digital zoom in and scale bar of 10 μm. Statistics: mean ± SEM,***P ≤ .001, n.s. P > .05, unpaired Students t-test. S: seconds, mm: millimeter
Figure Data
Acknowledgments
This image is the copyrighted work of the attributed author or publisher, and
ZFIN has permission only to display this image to its users.
Additional permissions should be obtained from the applicable author or publisher of the image.
Full text @ Dev. Dyn.