
Image
|
Figure Caption
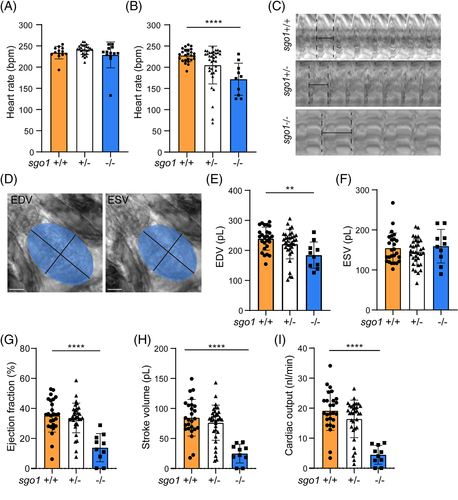
Fig. 2
sgo1−/− show functional heart defects at 5 dpf. (A) Heart rate measurements in sgo1+/+, sgo1+/−, and sgo1−/− larvae at 3 dpf (sgo1+/+ n = 13, sgo1+/− n = 26, sgo1−/− n = 13). (B) Heart rate measurements in wild type, heterozygous carriers and homozygous mutant larvae (5 dpf; sgo1+/+ n = 25, sgo1+/− n = 36, sgo1−/− n = 10). (C) Kymograph of beat-to-beat distances in wild-type, heterozygous carriers and homozygous mutant larvae (5 dpf). (D) Sample images of the ellipse taken at end diastolic volume (EDV) and end systolic volume (ESV). Measurements using EDV/ESV ellipse methods for wild-type, heterozygous carriers and homozygous mutants at 5 dpf include: (E) EDV, (F) ESV, (G) ejection fraction (EF), (H) stroke volume (SV), and (I) cardiac output (CO). All measurements were performed in two biological replicates. Statistics: mean ± SEM, P ≤ .05, ***P ≤ .001, ****P ≤ .0001, n.s. P > .05, one-way ANOVA. Bmp: beats per minute, pL: picoliter, nL/min: nanoliter per minute, mm2: square millimeter
Figure Data
Acknowledgments
This image is the copyrighted work of the attributed author or publisher, and
ZFIN has permission only to display this image to its users.
Additional permissions should be obtained from the applicable author or publisher of the image.
Full text @ Dev. Dyn.