
Image
|
Figure Caption
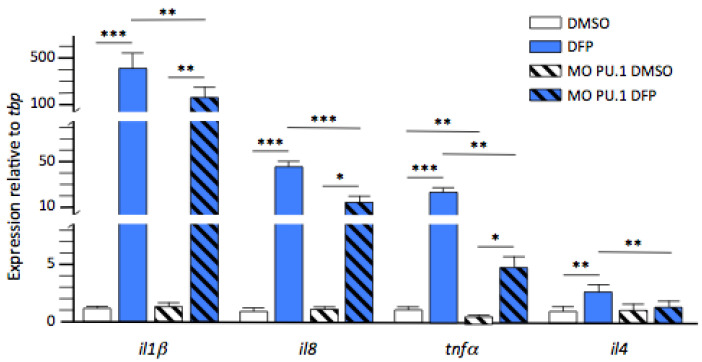
Figure 6
Microglia are key players in DFP-induced inflammation. Expression levels of transcripts encoding cytokines
Acknowledgments
This image is the copyrighted work of the attributed author or publisher, and
ZFIN has permission only to display this image to its users.
Additional permissions should be obtained from the applicable author or publisher of the image.
Full text @ Int. J. Mol. Sci.