IMAGE

Figure 3

ID
ZDB-IMAGE-220729-18
Source
Figures for Anderson et al., 2022
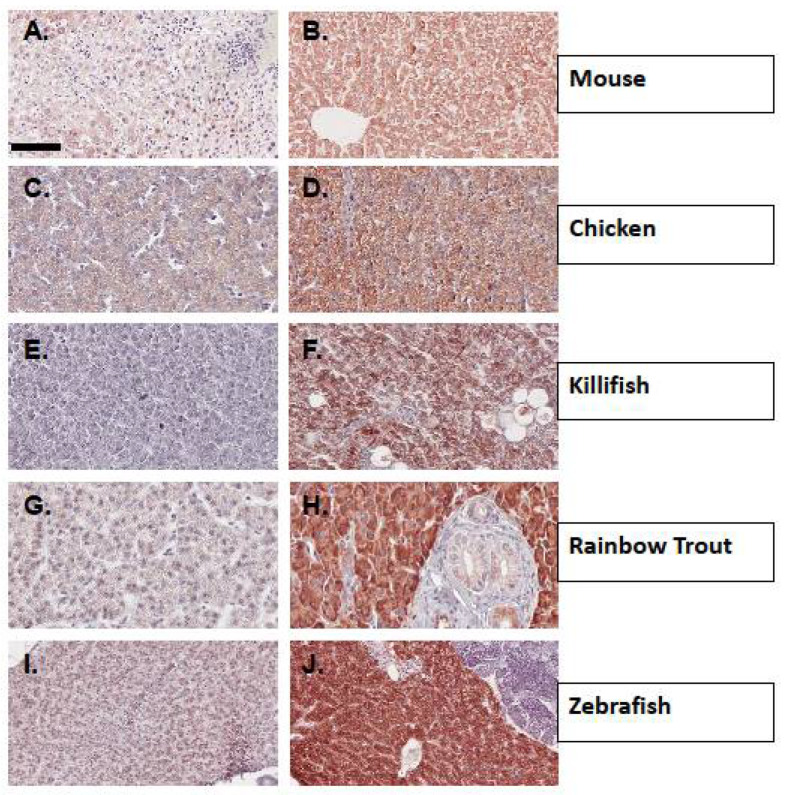
Image
Figure Caption

Figure 3

Immunohistochemical detection of CYP1A protein expression using mAb CRC4 in liver tissues from representative vertebrates. (A). Control mouse liver; (B). Liver from a PCB-126 treated mouse; (C). Control chicken embryo liver at 18 days post fertilization (DPF); (D). Liver from a crude oil vapor-exposed chicken embryo at 18 DPF; (E). Liver from CYP1A recalcitrant Gulf killifish; (F). Liver from Gulf killifish collected from a crude oil exposed site; (G). Control Rainbow trout liver; (H). Liver from a β-NF-exposed rainbow trout; (I). Control zebrafish liver; (J). Liver from PCB-126 treated zebrafish. (A,B) are 20× magnification, scale bar = 100 µm (CJ) are 40× magnification, scale bar = 50 µm. Details of tissue sources, experimental conditions, and procedures are found in Methods and Table 2.

Acknowledgments
This image is the copyrighted work of the attributed author or publisher, and ZFIN has permission only to display this image to its users. Additional permissions should be obtained from the applicable author or publisher of the image. Full text @ Toxics