
Image
|
Figure Caption
Fig. 4
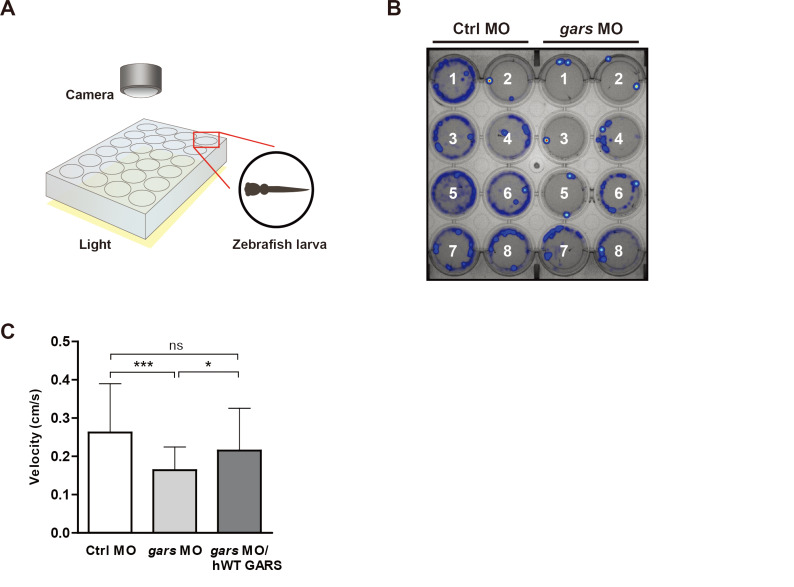
gars-KD zebrafish larvae have low motility.
(A) Simplified diagram showing how to use the DanioVision system to analyze zebrafish behaviors that occur when they respond to light stimulation. (B) Heatmap images comparing swimming patterns between control and gars MOs-injected larvae recorded for 30 min. (C) Quantification of velocity measured in zebrafish larvae injected with control MOs (n = 57), gars MOs (n = 47), and gars MOs with human WT GARS (n = 56) mRNAs. Statistical significance was assessed using one-way ANOVA followed by Tukey’s post hoc test. *P < 0.05; ***P < 0.001. ns, non-significant.
Figure Data
Acknowledgments
This image is the copyrighted work of the attributed author or publisher, and
ZFIN has permission only to display this image to its users.
Additional permissions should be obtained from the applicable author or publisher of the image.
Full text @ Mol. Cells