IMAGE

Fig. 3

ID
ZDB-IMAGE-220725-3
Source
Figures for Ciampi et al., 2022
Image
Figure Caption

Fig. 3

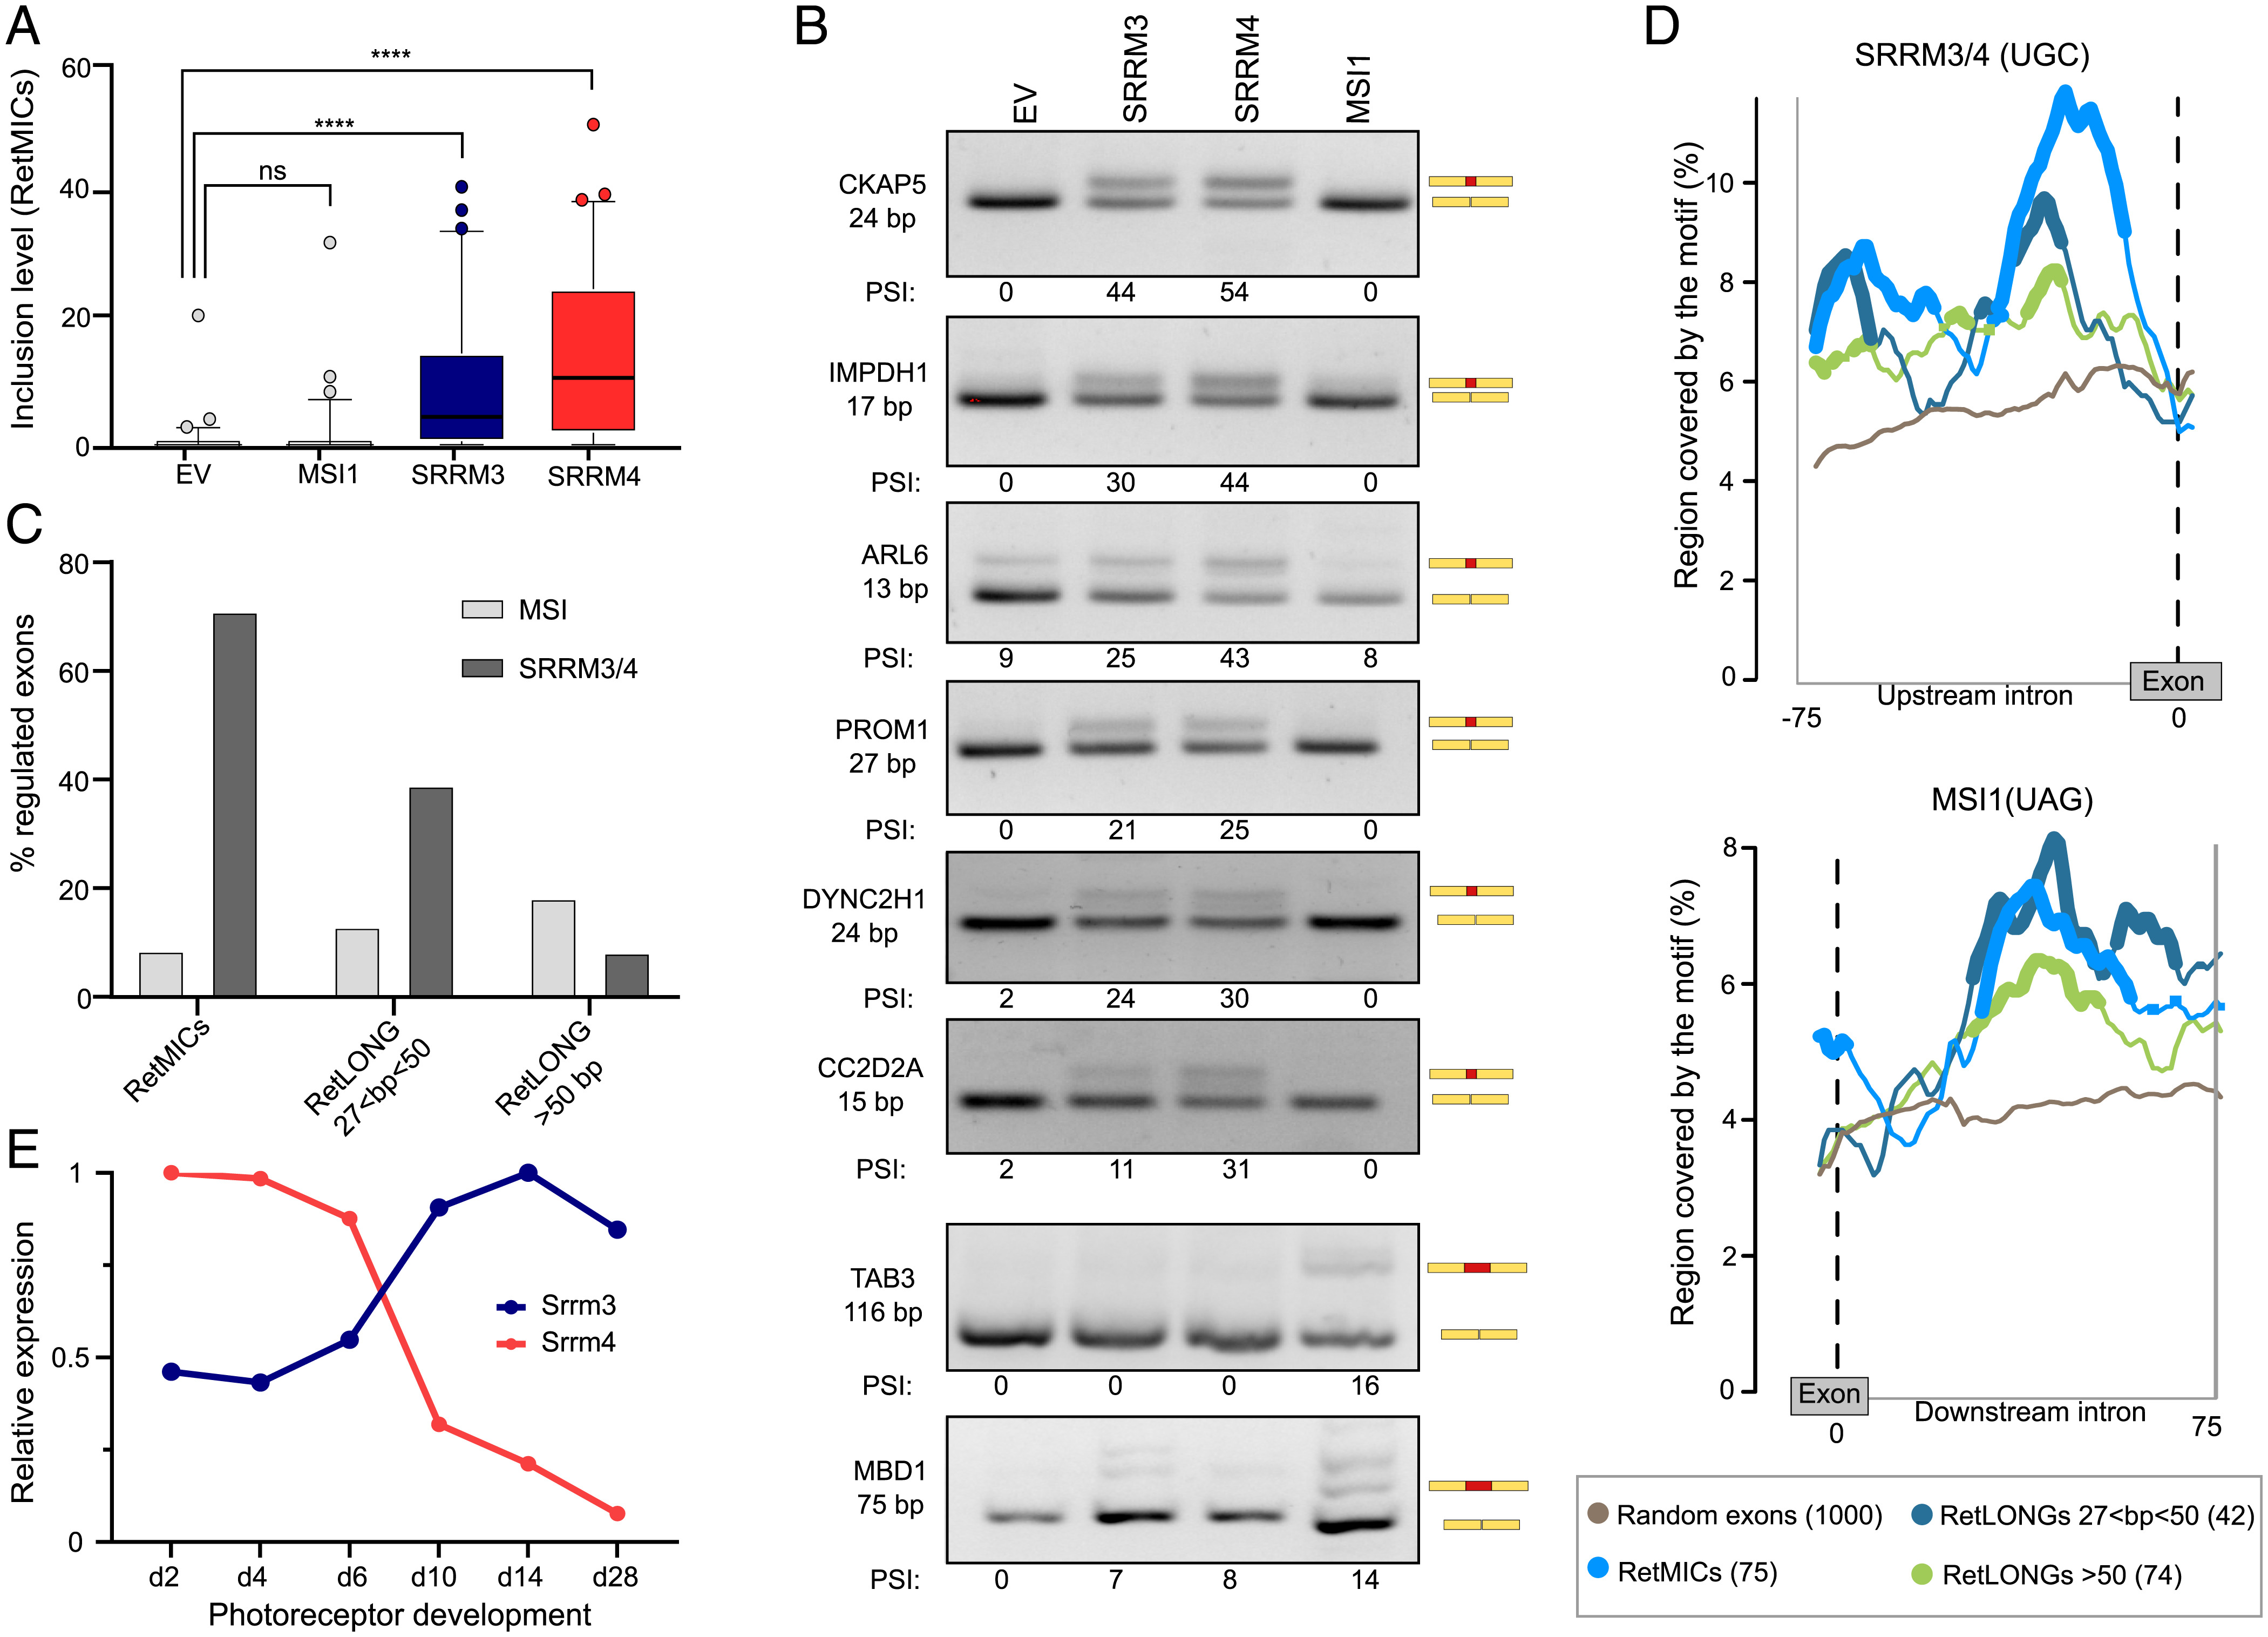
Regulation of RetMICs by MSI1, SRRM3, and SRRM4. (A) Inclusion levels (using the PSI metric) of RetMICs in HEK293 cells ectopically expressing SRRM3, SRRM4, and MSI1. EV, empty vector. PSIs are quantified using vast-tools on RNA-seq data from cells 24 h postinduction with 1 µg/mL doxycycline; ****P < 0.0001 Wilcoxon test; ns: not significant. (B) RT-PCR assays showing the inclusion of RetMICs (CKAP5, ARL6, IMPDH1, PROM1, DYNC2H1, and CC2D2A), a RetLONG (MBD1), and a known MSI1-dependent exon (TAB3) in HEK293 cell lines upon ectopic expression of SRRM3, SRRM4, and MSI1. PSI levels quantified using ImageJ are shown below each gel. (C) Percent of retina-enriched exons by length group that showed substantial up-regulation (ΔPSI > 15) upon SRRM3/4 (dark gray) or MSI1 (gray) expression in at least one experiment. (D) RNA maps of SRRM3/4 and MSI1 associated binding motifs in the regions surrounding retina-enriched exons by length group and 1,000 random exons used as a control set. For simplicity, only the relevant upstream (SRRM3/4) or downstream (MSI1) introns are shown (full maps shown in, Fig. S8). Regions with a significant difference (FDR < 0.05) in motif coverage in the tested exon group with respect to the random exons are marked by thicker lines. Sliding window = 27 bp. (E) Srrm3 and Srrm4 gene expression levels (using the cRPKM metric) across mouse developing rods (data from VastDB). Expression levels are normalized to the stage with the highest cRPKM value for each gene.

Acknowledgments
This image is the copyrighted work of the attributed author or publisher, and ZFIN has permission only to display this image to its users. Additional permissions should be obtained from the applicable author or publisher of the image. Full text @ Proc. Natl. Acad. Sci. USA