
|
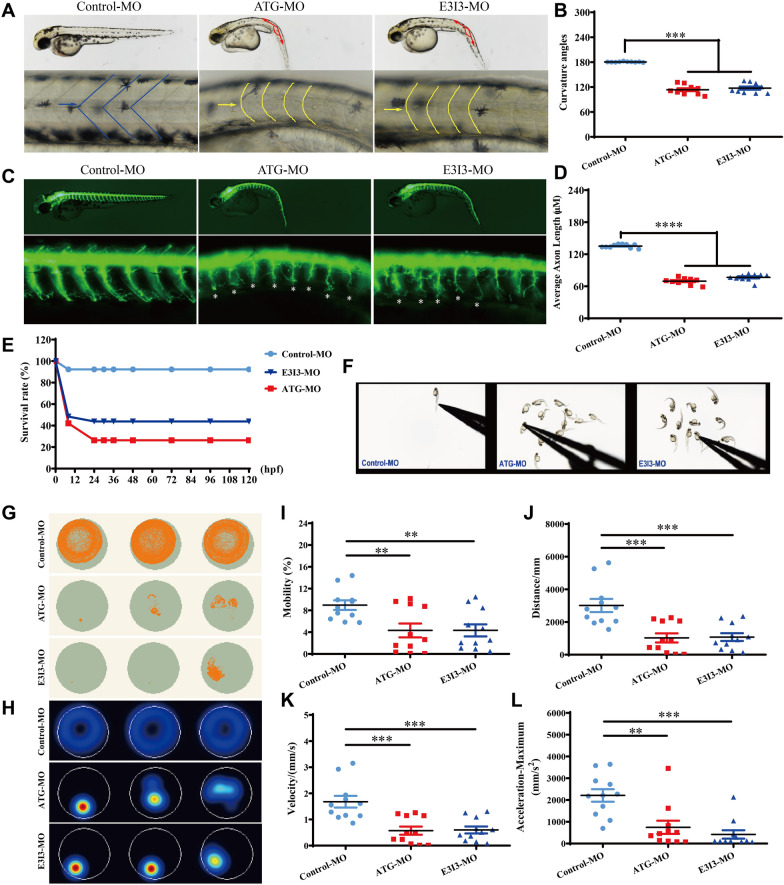
Fig. 7
Locomotor capacity is reduced in fars2 morphants. A–B Gross morphology of Tg (hb9:eGFP) zebrafish embryos at 54-hpf. hpf, hours post fertilization. Compared with control-MO, fars2 morphants present a curved body axis (blue dotted line) and U-shaped somites (yellow line and arrow). Quantification of the average curvature angle (mean ± S.E.M; One-way ANOVA with Bonferroni posthoc test, ***P < 0.001; n = 10). C Gross morphology of Tg (hb9:eGFP) zebrafish embryos at 54-hpf. Red lines depict the definition of curvature angle, asterisk indicates impaired motor axon. D Quantification of the average motor axon length reveals a decrease in fars2 morphants (mean ± S.E.M; One-way ANOVA with Bonferroni posthoc test, ****P < 0.0001; n = 10). E Time-course of percent survival in control vs. fars2 morphants for 5 days. n = 100. F The stereotypic escape response, normal in control larvae but highly reduced or absent in fars2 morphants. G–H Digital tracks and heat-map image in larvae from control-MO and fars2-MO injected groups at 5 dpf. dpf, days post fertilization. n = 10. I–L Total movement distance, velocity, mobility and maximum acceleration in fars2-MO group are significantly lower than those in the control-MO injected groups (mean ± S.E.M; One-way ANOVA with Bonferroni posthoc test, **P < 0.01; ***P < 0.001; n = 11).