
|
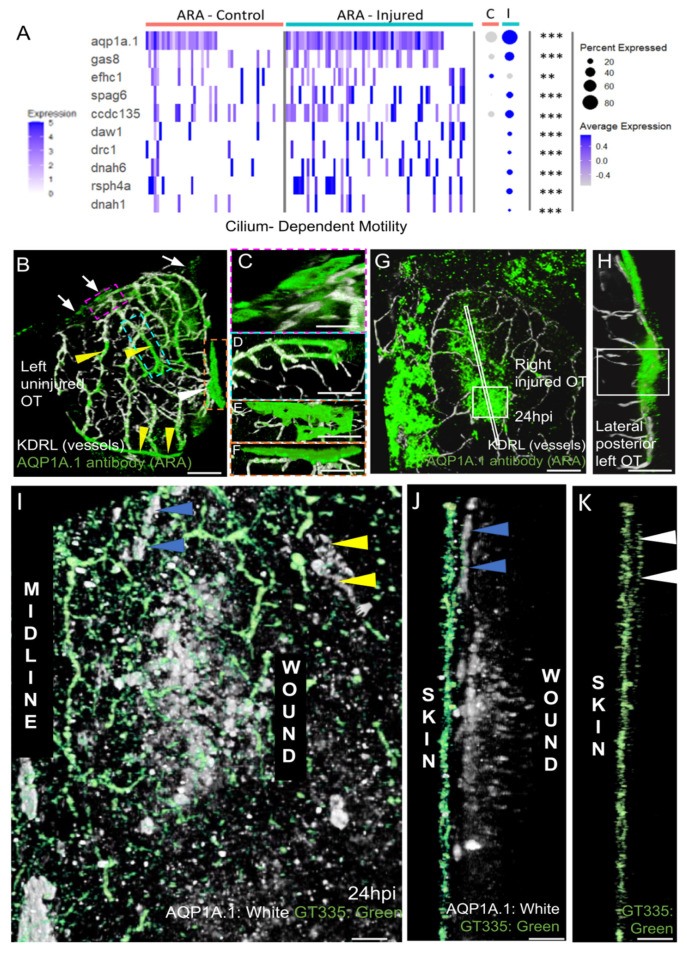
Fig. 8
AQP1a.1 ciliated ARA migrates towards the wound. (A) Expression of AQP1a.1 and cilia motility genes in cells depending on their status show overexpression of these genes after wounds. Genes expressed <10% of cells are not presented in dotplot. Adjusted p value (** <0.01 *** <0.001) concern markers in injured status. (B) Dorsal view on an uninjured OT with ARA (white arrows), MID (white arrowhead), and vessels (yellow arrowheads) stained by the AQP1a.1 antibody. Anterior at the top. Midline on the left. (C) Detailed dorsal view of ARA. (D) Detailed side view of ARA. (E) Detailed dorsal view of MID. (F) Detailed side view of MID. (G) At one dpi, strongly positive AQP1a.1 cells are visible over the wound (white arrowheads). (H) Strong and thick AQP1a.1 staining over the wound. (I) AQP1a.1-positive cells over and around the wound. Peripheral ARA-like cells: yellow arrowheads. (J) Migrating ARA stained by AQP1a.1: blue arrowheads. Lateral ARA: yellow arrowheads. (K) Migrating AQP1a.1-positive ARA are ciliated as shown by the GT335 staining: white arrowheads. AQP1a.1-positive cells do not exhibit any cilium/GT335 staining. Scale bars: (A,F): 100 μm; (B–E,G): 50 μm; (H–J): 10 μm.